In yesterday’s Advisor, we offered consultant David Insler’s take on compensation scorecards; today, his comparative charts for unit-to-unit and comp-to-business data.
 |
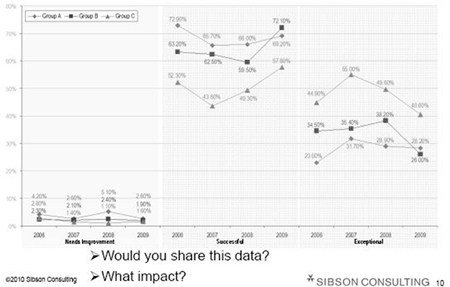
Unit Performance Differentiation
It’s hard to read the numbers in the chart below (sorry, readers), but it’s easy to see what it is saying.
The collection of data on the bottom right is for employees rated “needs improvement.” The middle grouping is for “successful performers,” and the grouping at the right is for “exceptional” performers. The chart shows the percentages of employees in each performance category over a 4-year period.
As you can see, Business Unit A (diamonds) does the best job at limiting the number of exceptional performers, generally below 20 percent of rated employees (and, thus, can reward them well). Business Unit C (triangles) does the worst job, with an almost equal number of “successful” and “exceptional” employees (and, thus, probably cannot differentiate meaningfully).
Comparative Compensation Scorecard
This chart, says Insler, compares compensation actions across units. In this case, for example, Business Unit D has the highest performance ratings, but low merit increases in spite of its low comparatio. This might bear looking into.
|
Business |
Average |
Average Merit |
Grade |
Compa- |
Annual |
|
A |
3.4 |
4.0% |
-3% |
101% |
100% |
|
B |
3.2 |
4.0% |
0% |
98% |
110% |
|
C |
4.0 |
4.2% |
12% |
96% |
105% |
|
D |
4.1 |
3.8% |
8% |
99% |
100% |
|
E |
3.6 |
3.6% |
17% |
88% |
110% |
|
F |
4.1 |
4.5% |
20% |
105% |
118% |
|
G |
3.2 |
3.5% |
-5% |
99% |
100% |
|
Average |
3.5 |
3.8% |
7% |
98% |
102% |
Source: Sibson Consulting
Connect Pay to Business Data
It is helpful to evaluate your average pay competitive position. This can be done in the aggregate, by business unit, or by employee level.
Be careful, however. Some companies may prefer to have fewer, highly compensated employees while others desire a greater number of employees who are not as well compensated.
In the table below, business unit performance is compared to selected compensation data. Unit F, for example has the highest net income per employee and the highest annual incentive. That’s what one might expect. However, Unit D, which has the lowest net income per employee, has the second highest annual incentive percentage; that might bear looking into.
Comp plan need a boost? Join us Thursday, July 10, 2014, for a free interactive webcast 5 Steps to Building Your Comp Plan. Earn 1 hour in Recertification Credit. Register Now
Comparative Compensation Scorecard
With Business Data
|
Business Unit |
Revenue per Employee |
Net Income per Employee |
Average |
Average Merit |
Annual |
|
A |
320K |
64K |
3.4 |
4.0% |
100% |
|
B |
280K |
42K |
3.2 |
4.0% |
110% |
|
C |
350K |
77K |
4.0 |
4.2% |
105% |
|
D |
290K |
52K |
4.1 |
3.8% |
100% |
|
E |
180K |
45K |
3.6 |
3.6% |
110% |
|
F |
360K |
82K |
4.1 |
4.5% |
118% |
|
G |
320K |
70K |
3.2 |
3.5% |
100% |
|
Average |
285K |
58K |
3.5 |
3.8% |
102% |
Tips for Developing a Compensation Scorecard
- Build a business case for why, what value, how to make better decisions, or how to keep employees better informed.
- Start small and narrow with just a few data points, to a few people, perhaps just senior execs.
- Make it “blind” at first, with no unit identification.
- Indicate how you compare: “our average merit was 3%, national average 2.5” or break down management vs. hourly, etc.
- Expand as the organization gets comfortable with transparency.
Paying top talent appropriately is critical to your organization’s success but so is controlling the bottom line. Having a solid comp plan will allow you to attract and retain top talent, motivate employees to perform at their best, and also stay on budget.
How to get there? Fortunately there’s timely help in the form of a July 10 webcast—5 Steps to Building Your Comp Plan. In just 60 minutes, you’ll learn everything you need to know to get your comp plan on track.
Register today for this free (thanks to sponsor PayScale) interactive webinar.
In tomorrow’s Advisor, more of Insler’s scorecard charts, plus news of a free (sponsored PayScale) webcast: 5 Steps to Building Your Comp Plan.
Comp plan need a boost? Join us Thursday, July 10, 2014, for a free interactive webcast 5 Steps to Building Your Comp Plan. Earn 1 hour in Recertification Credit. Register Now
By participating in this interactive webcast, you’ll learn how to:
- Gain executive support;
- Define your comp strategy;
- Develop a market-based pay structure;
- Build pay ranges; and
- Implement the total rewards plan.
Register now for this webcast.
Thursday, July 10, 2014
2:00 p.m. (Eastern)
1:00 p.m. (Central)
12:00 p.m. (Mountain)
11:00 a.m. (Pacific)
Approved for Recertification Credit
This program has been approved for 1 recertification credit hour toward recertification through the Human Resource Certification Institute (HRCI).
Join us on July 10 for the free, in-depth 5 Steps to Building Your Comp Plan webcast.
About Your Speaker
Karaka Leslie, PayScale Partnership Manager, has spent the last 5 years working with PayScale customers and partners. In her time at PayScale, Karaka has worked with numerous clients to help them understand the value of the PayScale solution and assist them with building a solid case for why having a compensation plan is so important. She has a passion for helping customers realize that any good talent management program must also include a great compensation program as a foundation.
Find out more about 5 Steps to Building Your Comp Plan