How Well Do You Measure Performance?
Regarding the way their organization conducts performance appraisals, a hefty 75.2% rate their organization as average or above. Details:
|
How well? |
Percent of Participants |
|
Excellent |
2.1% |
|
Above average |
21.9% |
|
Average |
51.2% |
|
Below Average, Needs Improvement, or Terrible |
24.8% |
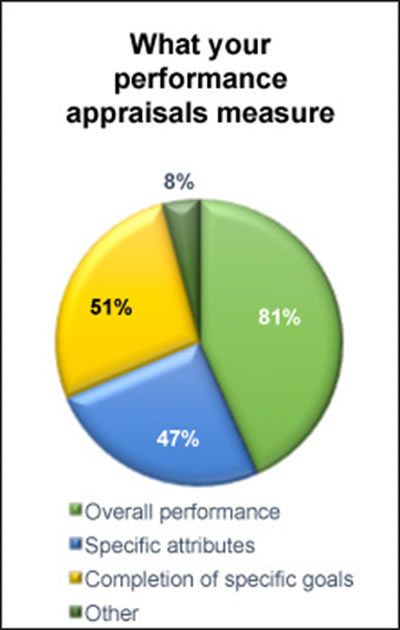
What Performance Appraisals Measure
Overall performance is measured by 80.7% of survey participants and specific attributes are measured by 47.2%. Completion of specific goals is a measurement criterion for 50.9%, and our favorite catchall “other” includes:
- Culture characteristics
- Leadership behavior
- Core competencies
- Developmental needs/training completed
- Adherence to organizational values
Compensation.BLR.com, now thoroughly revved with easier navigation and more complete compensation information, will tell you what’s being paid right in your state–or even metropolitan area–for hundreds of jobs. Try it at no cost and get a complimentary special report. Read More.
Nonexempt Employee Performance Factors
The top 5 factors used when evaluating nonexempt performance are the same as in 2013. Quality (89%) leads the list and is followed by attitude/cooperation (74.5%), communication skills (72.9%), attendance and punctuality (69.9%), and dependability/reliability (68.1%).
The 5 least used factors in nonexempt performance appraisals are interpersonal relationships (55.3%), safety (42.9%), flexibility (38.4%), resourcefulness (30.3%), and creativity (25.6%).
Flagged by 13.5% of survey participants, the “other” basket included performance factors such as:
- Values
- Job knowledge
- Adaptability
- Teamwork
- Integrity
- Boldness
- Initiative
- Problem solving

Exempt Employee Performance Factors
|
Factor |
Percentage of Respondents |
|
Communication skills |
79.1% |
|
Job knowledge |
75.5% |
|
Achieving goals |
72.5% |
|
Leadership |
67.2% |
|
Decision-making ability |
66.7% |
|
Organizing ability |
44.5% |
|
Attendance/punctuality |
41.1% |
|
Financial management |
37.2% |
|
Creativity |
33.8% |
|
Staff utilization |
25.0% |
|
Other |
10.6% |
The “other” basket for exempt employee performance factors includes teamwork, innovation, collaboration, accountability, and alignment with company goals.
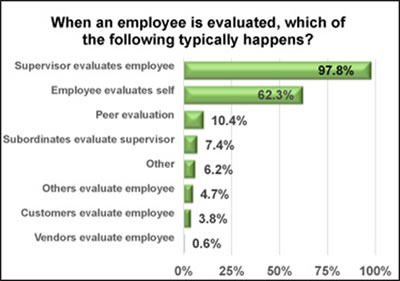
Evaluation Process
Not surprisingly, supervisors evaluating employees is the norm for 97.8% of survey participants. Employee self-evaluation is part of the process for 62.3% (up from 58% in 2013), and peer evaluation is a best practice for 10.4%. Subordinates evaluating supervisors is an option for 7.4% of survey participants, and 3.8% have a mechanism in place for customers to evaluate their employees.
When asked which employee groups do not receive evaluations, 31.4% indicated that temporary employees’ performance is not formally reviewed. Senior management/executives are not reviewed by 19.6% (23% in 2013) and part-time employees do not receive performance reviews at 10.9% of survey participants’ organizations.
Performance evaluations accomplish their intended goal most of the time for 47.5%. They are great in theory but nearly impossible to implement for 28.6%, and 4.3% believe they are not a good idea so they would like to abolish them altogether.

Frequency/Timing
Performance appraisals are conducted annually for 48.7%. They are conducted after the first 90 days and then annually thereafter for 24.1%. Reviews are every 6 months for 12.7% of survey participants and 2.8% have no firm schedule. The “other” basket for this question reveals quite a few options, including:
- Annually with a midyear check-in
- Quarterly
- After first 90 days, after 6 months, then annually
- Semiannually
- When there is a job performance issue
New employees receive their first performance review after 6 weeks on the job for 7.9% of survey participants and after 3 months for 44.1%. “Newbies” get their first review after 6 months for 17.2% and after 9 months for 0.6%, while 14.1% receive their first indicator of success or failure after a full year of employment.
A common review date is utilized by 56.5% of participants and a variation of common review dates (e.g., common dates staggered by groups) is used by 6.4%. Appraisals are spread out over the year for 22.9%, and a combination of common date and scattered throughout the year is used by 8.6% of survey participants. Conducting all reviews at the same time is preferred by 47.2%, and 29.8% prefer that they be spread throughout the year. A combination is preferred by 15.6%, and 7.4% had no opinion one way or the other.

The frequency with which individual pay for performance plans are aligned with organizational objectives and strategies is annually for 60.4% and biannually for 1.1%. Alignment is intermittent with no set schedule for 11% and never (as far as they know) for 19.9% of survey participants.
No performance reviews are conducted by 9.6% of survey participants. When asked what they do instead, their responses included across-the-board increases (2.2%), informal feedback (12.5%), ongoing coaching (8.9%), reacting to mistakes (2%), and nothing (25.4%).

Try BLR’s all-in-one compensation website, Compensation.BLR.com®, and get a complimentary special report, Top 100 FLSA Overtime Q&As, no matter what you decide. Find out more.
Forms and Tools
Basically, the same form is used for all or almost all employees at the organizations represented by 46.3% of our survey participants. Different forms for different departments or positions are used by 17.4%, and different forms for exempt vs. nonexempt are used by 12.7%. Management appraisals are conducted using a different form than the one used for nonmanagement employees by 15.9%, and 2.3% have no standard form.
Appraisal forms with ratings/scales work well for 78.8%, and essay questions work for 23.5%. Multiple choice review statement/questions work well for 12.7%, and 5.7% like yes/no statement/questions.

Performance review software is not an option for 63.9% of survey participants, and 7.3% have no performance appraisal software but are interested in learning more about it. Software is used by 13.9% with good results but using it hasn’t improved the process for another 7.8%. A small group, (1.4%), has looked for such software but not found anything that meets their needs.
When it comes to what kind of software is used, the responses in our survey are all over the map. SuccessFactors is used by 11.3%, Halogen eAppraisal is used by 11.3%, and Cornerstone OnDemand is used by 4.1%. The largest group is the “other” basket at 58.4%. It contains over 20 different software options with in-house developed software leading the pack at 17.1%, followed by ADP at 10.7% and PeopleSoft at 5.35%.
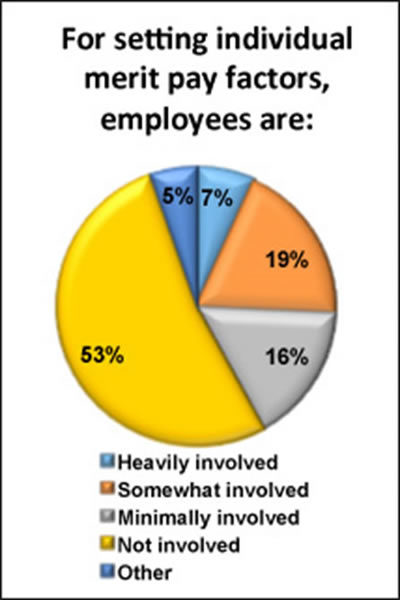
Employees’ Role in Performance Appraisals
When setting individual performance pay factors, employees are heavily involved for 6.8% of our survey participants and somewhat involved for 18.9%. They are minimally involved for 16.3% and not involved at all for 52.6%. For 48.1% of our survey participants, employees have sufficient impact on individual performance factors that impact their pay and for 34.8% they do not. The remaining 17.2% are not sure.
When asked if they thought employees in their organization would agree that they have sufficient impact on individual performance factors that impact their own pay, 22.9% believe they would agree, and 45.5% believe they would not. The remaining 31.6% are not sure one way or the other. Along those same lines, 22.6% believe that the employees in their organization are pleased with their individual pay for performance program, 41.3% do not, and 36.1% are not sure.
In tomorrow’s Advisor, the rest of the survey results, plus an introduction to the all-things-compensation-in-one-place website, Compensation.BLR.com.