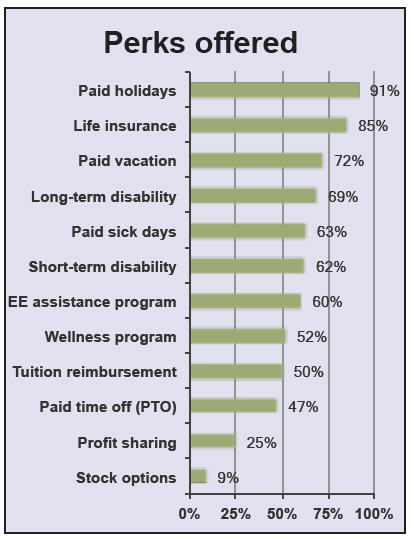
Beyond health insurance and retirement benefits (covered in previous surveys), the number one perk provided by the employers responding to our survey was paid holidays, with 91% percent of them offering it. Other highlights:
- Flextime is offered by 53% of respondents.
- About 33% relax their dress code in the summer, at least for some employees.
- Life insurance is provided by 85% of respondents.
- Paid vacation is a benefit offered by 72%.
- Tuition reimbursement policies vary widely.
Compensation.BLR.com, now thoroughly revamped with easier navigation and more complete compensation information, will tell you what’s being paid right in your state—or even metropolitan area—for hundreds of jobs. Try it at no cost and get a complimentary special report. Read more.
Here are the detailed survey results. How does your organization measure up?
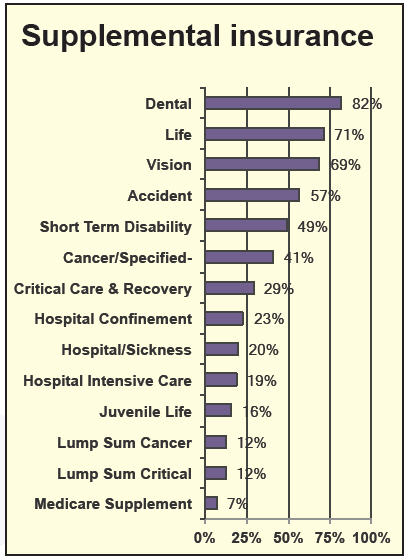
Supplemental Insurance
Voluntary supplemental insurance plans offered by employers include dental insurance, topping the list at 82% of employers, and life insurance coming in second at 71%. Vision insurance is provided by 69% of our survey participants and accident insurance is offered by 57%. Lump-sum cancer and lump-sum critical illness insurance are both offered by 12%, and the least-offered voluntary benefit is a Medicare supplement by 7% of the employers responding to our survey.
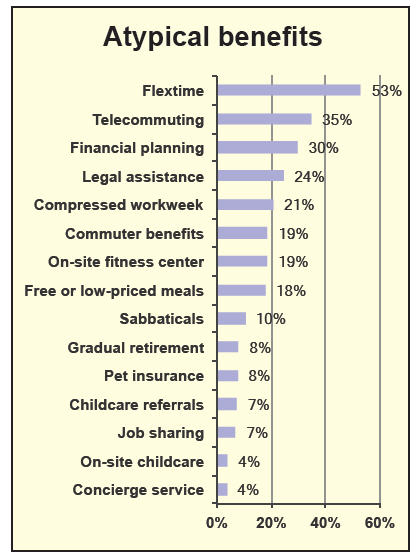
Atypical Benefits
Flextime is the most commonly offered (53%) atypical benefit offered by employers. Other atypical benefits being offered include telecommuting (35%), financial planning assistance (30%), legal assistance programs (24%), on-site fitness centers (19%), and commuter benefits (19%). The least-offered atypical benefits are on-site childcare (4%) and concierge services (4%).
When asked if their business competitors offered similar nonwage benefits, 37% did not know, 33% responded that they do, 22% responded that their own benefits are more generous than those of their competitors, and 8% indicated that their benefits are less generous.
Benefits Planning
Conducting employee surveys to find out which benefits they like is how 26% of employers determine what nonwage benefits to offer employees and 43% evaluate the benefits offered by other companies as well as their competitors. Hiring a consultant to develop a benefit plan, however, is the norm for 23%.
Almost half (42%) of survey participants conducted a comprehensive evaluation of their benefits packages in 2012 and 19% have done so in 2013. A review of benefits was conducted in 2011 for 10% and in 2010 for 6%. It was before 2010, though, for 23%.
Other than for their health insurance package, no changes are planned in 2014 for 50% of survey participants. Minor changes are in store for 31% and moderate changes are planned for 15%. Significant changes are on deck, however, for 4% of employers in 2014.
Tuition Reimbursement
Both exempt and nonexempt employees are eligible for tuition reimbursement for 64% of employers and part-time employees are eligible for 21%. For those that offer this benefit:
| Tuition Policy Issue | Percent of respondents |
| Years of employment to be eligible | |
| Less than 1 year | 40% |
| At least 1 year | 49% |
| Courses must be job-related | 82% |
| Cost of books and supplies is reimbursable | 53% |
| Graduate level courses are reimbursed | 76% |
| Cost of professional certification courses is reimbursed | 79% |
| A passing grade is required | 91% |
| Grade is verified prior to reimbursement | 91% |
| Maximum annual amount of tuition reimbursement is: | |
| Less than $1,000 | 19% |
| Up to $2,000 | 19% |
| As much as $3,000 | 15% |
| Above $3,000 | 17% |
| Capped only by IRS deductibility | 22% |
| The grade earned is a factor in the amount of reimbursement | 11% |
| Repayment of tuition reimbursement if the employee leaves the company | |
| Is never required | 38% |
| Is required on a case-by-case basis | 15% |
| Is required if the employee leaves within one year of course completion | 30% |
| Is required if the employee leaves within 2 years of course completion | 16% |
No changes to their tuition assistance program are anticipated for 93% of employers, though 4% plan to reduce reimbursement benefits and 3% plan to increase them.
Telecommuting
Less than half (37%) of employers that answered this question in our survey offer telecommuting as a benefit to their employees. It has been a perk for more than 5 years for 15% of employers, though, and for 1 to 5 years for 18%.
Formal telecommuting guidelines are in place for 25% and employees are required to sign a formal agreement for 28% of employers. A separate work area in the employee’s home is required by 27%, and 21% require the telecommuting employees to have child care other than themselves. An allowance to cover employee expenses for setting up telecommuting at their home is provided by 14%, and 28% reimburse telecommuting employees for such monthly expenses as telephone and Internet connections.
Offering telecommuting to employees brings improved employee morale to 64% of the employers that offer it and improved recruiting and retention is realized by 48%. Telecommuting reduces absenteeism for 43% and saves on office space and other resources for 36%. Higher employee productivity is a benefit of telecommuting for 39% of employers.
When asked how satisfied they are with their telecommuting arrangements, 22% indicated they are very satisfied, 23% are somewhat satisfied, 45% are neutral, 6% are somewhat dissatisfied, and 4% are very dissatisfied.
Flextime
Some flexible hours are available to exempt employees for 52% of survey participants and none are available for 33%. Compressed workweeks are available for 12% and total flexibility is available for 6%.
Nonexempt employees are allowed some flexible hours by 47% of employers and no flextime for nonexempt employees is allowed by 42%. Compressed workweeks are an option for nonexempt employees for 11% of survey participants and total flexibility is available for 3%.
Dress Codes
Personal appearance is relaxed and casual for 49% of employers responding to this question in our survey and very relaxed for 11%. Traditional business attire is required for 39% and it’s strictly suits for slightly less than 1%. Their dress code is relaxed during the summer months for 33% of survey participants but only for employees with no customer contact for 13%.
Dress-down days are offered by 51% but only for employees with no customer contact for 14%. Friday casual is the norm for 65% but only on or near holidays for 10%. Dress-down is a reward for performance or fundraising for 4%.
Survey Participants
| Percent of survey participants | |
| Size | |
| Up to 250 employees | 64% |
| 251 to 1,000 employees | 21% |
| 1,001 to 10,000 employees | 12% |
| More than 10,000 employees | 3% |
| Percentage of exempt employees | |
| 20% or fewer exempt employees | 40% |
| 21% to 50% exempt employees | 34% |
| More than 50% exempt employees | 27% |
| Percent of respondents with unionized employees | 19% |
Privately held organizations are represented by 57% of survey participants and nonprofits account for 17%. Public corporations make up 9% and governments are represented by 8%.
Industries include manufacturing (17%); health care and social assistance (14%); finance and insurance (9%); and professional, technical, and scientific services (8%). Educational services represent 6% of our survey participants and retail trade accounts for 4%.
The positions held by our 1,493 survey participants include:
| HR Coordinator | 5% |
| HR Generalist | 9% |
| HR Specialist | 5% |
| HR Manager | 26% |
| HR Director | 23% |
| HR VP or above | 9% |
| Other area with HR responsibilities | 23% |
THANKS to all who participated in the survey!
Upcoming survey topics include:
- Training and Development
- Performance Management
- Pay budget
These results are fascinating. I’d love to have a comparison with earlier results. For example, are relaxed dress codes becoming less common after having surged in past years? I’ve heard anecdotal evidence that that’s the case.