- The most common HR-to-employee ratios are between 1 to 101 and 1 to 200.
- While 1% of respondents earned over $200,000 per year, the most commonly reported salary was between $51,000 and $70,000 per year.
- The most commonly outsourced function was background checks
Thanks to all 1,839 companies that participated in the survey!
Here are the detailed survey results. How does your organization measure up?
Compensation.BLR.com, now thoroughly reved with easier navigation and more complete compensation information, will tell you what’s being paid right in your state—or even metropolitan area—for hundreds of jobs. Try it at no cost and get a complimentary special report. Read more.
Staff-to-Employee Ratio
When asked about their HR staff-to-employee ratio, 42.4% indicated that their HR departments operate with a ratio between 1 HR professional to 101 employees and 1 HR professional to 200employees. A closer look shows that 18.2% operate with a ratio of 1 to 101–150, 10.1% operate with a ratio of 1 to 151–200, and 14.1% operate with a ratio of 1 HR professional to 201 or more employees. On the flip side, 26.3% operate with a ratio of 1 to 50, and 31.3% operate with 1 HR professional for 51–100 employees.

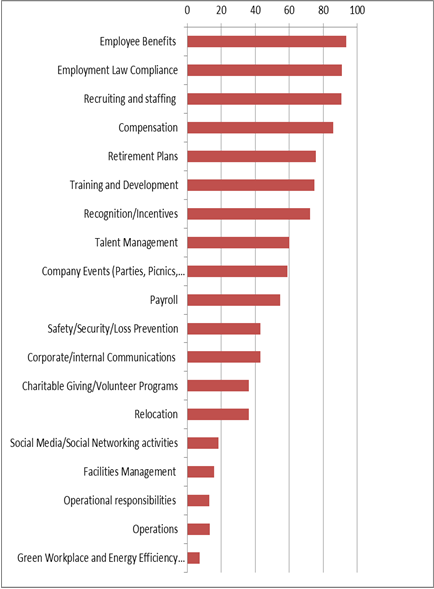
What Are Your Departmental Responsibilities?
Training companywide supervisors and employees on employment law issues is the responsibility of 65% of survey participants, and training them on job requirements is the responsibility of 36.4%. Facilities management is the responsibility of 13.2%, and safety/security is managed by 34.3%.
| Employee Benefits | 93.4% |
| Employment Law Compliance | 91% |
| Recruiting and Staffing | 90.6% |
| Compensation | 85.8% |
| Retirement Plans | 75.5% |
| Training and Development | 74.9% |
| Recognition/Incentives | 72.1% |
| Talent Management | 59.9% |
| Company Events (Parties, Picnics, Ceremonies, etc.) | 59% |
| Payroll | 54.5% |
| Safety/Security/Loss Prevention | 43% |
| Corporate/Internal Communications | 43.1% |
| Charitable Giving/Volunteer Programs | 36.3% |
| Relocation | 36.1% |
| Social Media/Social Networking Activities | 18.3% (16% in 2012) |
| Facilities Management | 15.8% |
| Operational Responsibilities | 13.1% (10% in 2012) |
| Green Workplace and Energy- Efficiency Initiatives | 7.2% (6% in 2012) |
Percent of Departments Reporting Responsibility for …

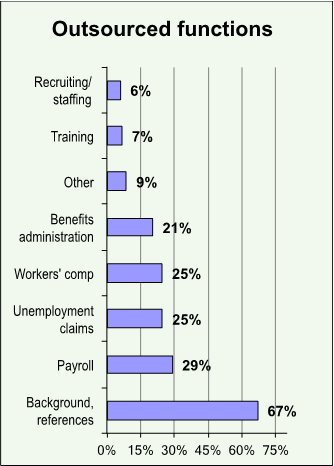
Outsourced Functions
Of those that do, the most frequently outsourced function is background/reference checks at 67.1% (up from 60% last year), followed by payroll for 29.2% (down from 38% last year), then unemployment and workers’ compensation claims processing at 24.8% and 24.7%, respectively (28% and 27% last year). Benefits administration is outsourced by 20.5% of respondents (down from 23% in 2012). Additional outsourced functions include training at 6.9% and recruiting/staffing at 6.1%.

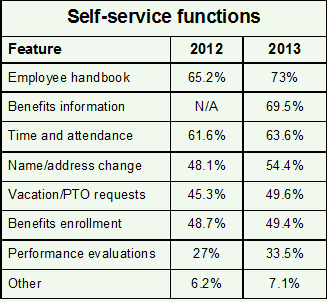
What Functions Are Self-Service?
Much like in 2012, the HR function most frequently provided as an online self-service feature to employees is the employee handbook for our 2013 survey participants (73% in 2013 vs. 65% in 2012). At 69.5%, benefits information is the second most frequent employee service featured online this year, though benefits enrollment is sixth place at 49.4%.
Time and attendance is online for 63.6%, and name/address change is self-service for 54.4%. Vacation/PTO requests are online for 49.6% vs. 45% in 2012, and performance evaluations are available for 33.5%, up from 27% in 2012.

What Are HR Managers Paid?
While 1% of respondents earned over $200,000 per year, the most commonly reported salary was between $51,000 and $70,000 per year.

How Does HR Use Social Media
When asked which social media format they use, 70.9% of survey participants identified their company’s intranet as the vehicle they use to communicate information to employees. Coming in a distant second, text messaging is used by 21.3%, and Facebook is an option for 16.4%.

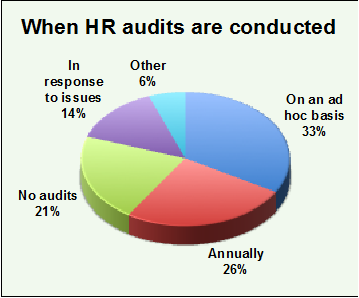
Who Conducts HR Audits?
Corporate HR is the leading conductor of audits at 32.7% of survey participants’ organizations, and an internal audit department conducts the audit at 30.4% of respondents. Outside consultants are brought in at 22.7%, and the legal department conducts the HR audit at 4.5%. Risk management leads the audit team at 3.1%, and the compliance officer provides this service at 8.2%. The finance department conducts the audit at 6.1%, and the operations department is responsible for conducting the audit at 2%.

How Strategic Is HR?
HR is viewed as a strategic partner by management teams for 32.5% of survey participants and as a credible business asset for 29.4%. It’s still viewed as an administrative function, though, for 34.1%.

Over three quarters of our survey participants play a role in strategic business planning at their organizations with 37.6% holding a position of influence within the inner circle. HR plays a major role, though outside the inner circle, for 25.4%, and at least 23.6% of HR departments play a minor role. HR has no role in strategic business planning for 12.4% of survey respondents.
Who’s the Boss?
Our 2013 survey reveals that HR reports to a variety of executives:
| CEO or Owner | 39.5% |
| President or Executive Director | 22% |
| CFO/head of Finance | 14.2% |
| Head of Operations | 9.2% |
| In-house legal counsel | 2.1% |
Departmental Changes
No significant changes have been experienced in the last year by 42.7% of participants in our survey, though 16% of the HR departments have been reduced in size, and departmental budgets have been reduced for 15%. Automation initiatives have been undertaken by 28.4%, while 4.3% have implemented shared services models and 6.5% increased outsourcing. Previously outsourced functions were brought back into the HR department by 2.7%, size of the department increased for 15%, and departmental budgets increased for 6.8%.
Challenges
A variety of challenges face our survey respondents.
| Healthcare reform | 22% |
| Recruiting for | 20% |
| Employee motivation and retention | 13% |
| Smaller HR departments and/or increased workload | 10% |
| Compliance issues | 7% |
| Implementing systems and/or managing data | 7% |
| Mergers/acquisitions/growth | 7% |
| Comp & benefits | 6% |
| Budget limitations | 5% |
| Talent and/or performance management | 5% |
| Training/development | 5% |
| Managing change | 2% |
| Getting or keeping a seat at the table | 2% |
| RIF/downsizing | 2% |
About You
HR managers and directors account for 53.4% of the survey participants who self-identified, other HR professionals make up 29.2%, and 17.4% are in other areas with HR responsibilities.
Full-time positions are held by 95.9%, 89.1% are in exempt positions. Long hours are routine for 93.2% of survey respondents who work an average of more than 40 hours a week (up from 73% in 2012).
Many of the HR departments represented in our survey are small, with 32.5% being one-person departments and 2- to 3-person departments accounting for 30.2% of survey participants. Departments with 4–6 comprise another 15%, and 6% have departments with 7–10 on their staff. Larger departments are represented as well. Departments with 11–20 employees are represented by 6% of survey participants, and 8% are departments with more than 20 HR professionals.
An experience level of 6–10 years accounts for 15% of survey participants, and 72.7% have more than 10 years of HR experience. A bachelor’s degree is required for 59.8%, and a master’s degree is required for 14.9%. Some college or an associate’s degree is required for 18.4%. Professional certification is required for 18.5%, with PHR (Professional in Human Resources) at 53.4% and SPHR (Senior Professional in Human Resources) at 40.4% of those requiring certification.
Participants
The majority of our survey respondents provide guidance to small- or medium-size employers, with 53.9% providing HR services to a workforce of 1–250 employees and another 16.8% providing guidance to 251–500 employees at their organizations.
Among our survey respondents, 20.6% have a workforce that is 10% or less exempt, and 20.4% have a workforce that is 11%–20% exempt. At the other end of the scale, 5.5% have a workforce that is 81%–90% exempt, and 4.5% have a workforce that is 91%–100% exempt employees.
Of the survey participants, 21.5% have employees that belong to a union, with 1% having a 91%–100% unionized workforce and 5% having a workforce that is 10% or less unionized.
A little over half (50.5%) of the participants are in service industries; 22.6% are in agriculture, forestry, construction, manufacturing, or mining; 7.4% are in wholesale, retail, transportation, or warehousing; and 19.3% are in real estate, utilities, or “other.”
A total of 1,839 organizations participated in this survey, conducted in August 2013. Of those who identified themselves, 51.9% are privately owned, 11% are public corporations, and 28.1% are government or nonprofits. Another 2.8% are educational institutions, and 3.7% are cooperatives or employee/member owned.
Thanks to all who participated in the survey!
Next survey topics include Employee Leave and Holidays.
