Benefits often make a real difference in attraction and retention. Here’s how you compare on perks from health insurance to stock options to paid vacation.
 |
Highlights of our 2014 Perks Survey of over 2,000 employers:
- The number one perk is paid holidays.
- Also in the top five: life insurance, LTD, STD, and paid vacation.
- For exempt employees, flextime is offered by 60.9%.
- Other benefits being offered include:
- Financial planning assistance (51.7%),
- Telecommuting (49.2%),
- Legal assistance programs (39.8%),
- On-site fitness centers (29.2%), and
- Commuter benefits (24.7%).
Paid Holidays #1
Paid holidays is the number one perk provided for both exempt and nonexempt employees, with 97.5% and 95.9%, respectively. Up from last year (85%), life insurance is provided by 95.3% for exempt employees and by 93.7% for nonexempt employees. Rounding out the top five benefits for exempt employees are long-term disability, paid vacation, and short-term disability. The top five benefits for nonexempt employees include paid vacation for 87%, short-term disability for 83.9%, and long-term disability for 83.8%.
At the other end of the spectrum, the least-offered benefit is concierge service at 4.4% for exempt and 4.2% for nonexempt. The bottom five benefits also include on-site child care, pet insurance, job sharing, and childcare referral options.
|
Exempt Employee Benefits |
|||
|
Top 5 |
Bottom 5 |
||
| Paid holidays |
97.5% |
Childcare referral options |
18.4% |
| Life insurance |
95.3% |
Job sharing |
13.2% |
| Long-term disability |
88.3% |
Pet insurance |
9.5% |
| Paid vacation |
87.9% |
On-site child care |
6.2% |
| Short-term disability |
84.8% |
Concierge services |
4.4% |
|
Nonexempt Employee Benefits |
|||
|
Top 5 |
Bottom 5 |
||
| Paid holidays |
95.9% |
Childcare referral options |
18.2% |
| Life insurance |
93.7% |
Job sharing |
14.6% |
| Paid vacation |
87.0% |
Pet insurance |
9.5% |
| Short-term disability |
83.9% |
On-site child care |
6.9% |
| Long-term disability |
83.8% |
Concierge services |
4.2% |
HR budget cuts? Let us help. HR.BLR.com is your one-stop solution for all your HR compliance and training needs. Take a no-cost, no-obligation trial and get a complimentary copy of our special report Critical HR Recordkeeping—From Hiring to Termination. It’s yours—no matter what you decide.
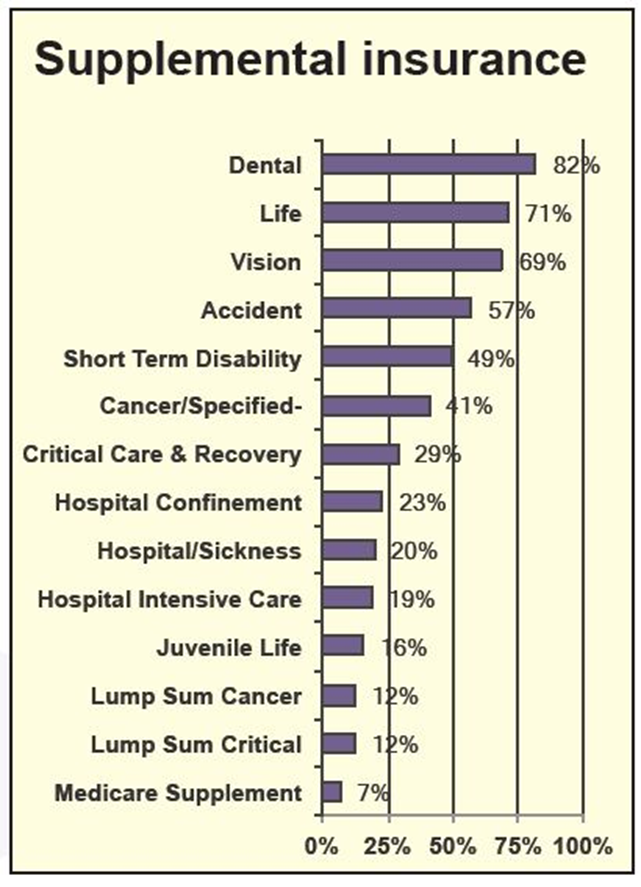
Supplemental Insurance
Voluntary supplemental insurance plans offered to exempt employees include dental insurance, topping the list at 95.3% of employers, and vision insurance, coming in second at 85.9%. Accident insurance is next at 83.2%, then life or juvenile life at 80.3%. Lump sum cancer and lump sum critical illness insurance are both offered by 52.6% (up from 12% in 2013), and the least-offered voluntary benefit is Medicare supplement, by 36.5% of the employers responding to our survey.
For nonexempt employees, the picture varies only slightly, with dental insurance topping that list at 94%, followed by vision insurance at 85%. Accident insurance comes in third on this list as well, at 82.6%.
Atypical Benefits
For exempt employees, flextime is the most commonly offered (60.9%) atypical benefit offered by employers. Other atypical benefits being offered include: financial planning assistance (51.7%), telecommuting (49.2%), legal assistance programs (39.8%), on-site fitness centers (29.2%), and commuter benefits (24.7%). The least-offered atypical benefits are on-site child care (6.2%) and concierge services (4.4%).
For nonexempt employees, however, financial planning assistance tops the list at 50.9%, followed by flextime at 48.4%. Other atypical benefits being offered to nonexempt employees include legal assistance programs (39.2%), telecommuting (27.8%), commuter benefits (23.4%), and job sharing (14.6%). The least-offered atypical benefits are on-site child care (6.9%) and concierge services (4.2%).
When asked how their benefits compare with their competitor employers, 39% indicated they were about the same, 37.8% responded that their own benefits are more generous than their competitors’, and 8.5% indicated that their benefits are less generous.
Benefits Planning
Conducting employee surveys is the method used by 23.8% of employers to determine what nonwage benefits to offer employees and 38% use surveys to evaluate the benefits offered by other companies as well as by their competitors. Hiring a consultant to develop a benefit plan, however, is the norm for 61.4%.
A little over half (52.5%) of survey participants conducted a comprehensive evaluation of their benefits packages in 2013 and 24.6% have done so in 2014. A review of benefits was conducted in 2012 for 8.6% and in 2011 for 2.6%. It was before 2011, though, for 11.8%.
No changes are planned for 2014 to 2015 for 13% of survey participants. Minor changes are in store for 49.3% and moderate changes are planned for 30.7%. Significant changes are on deck, however, for 7%.
Find out what the buzz is all about. Take a no-cost look at HR.BLR.com, solve your top problem, and get a complimentary gift.
Tuition Reimbursement
Both exempt (71.2%) and nonexempt (69.6%) employees are eligible for tuition reimbursement and part-time employees are eligible for 17.8% (down from 21% in 2013). For those that offer this benefit, less than a year of employment is required for employees to be eligible at 42.1%, and at least 1 year is required for 49.1%.
The maximum annual amount of tuition reimbursement is less than $1,000 for 16.9% of survey participants. It is up to $2,000 for 27% and as much as $3,000 for 14.5% of employers. The reimbursement level is above $3,000 for 42.3%.
Repayment of tuition reimbursement is never required by 30.5% of employers, even if the employee leaves the company. Repayment is required on a case-by-case basis for 17.3%. It depends on the timing of the departure for 52.2%.
In tomorrow’s Advisor, we present the rest of the survey results, plus we announce a timely webinar on variable pay and incentives.