Yesterday’s Advisor began our coverage of BLR’s 2014–2015 Pay Budget Survey results. Today, the rest of the results, including 2015 compensation planning.
[Go here for 2014 data and the rest of the survey results]
2015 Merit Increases
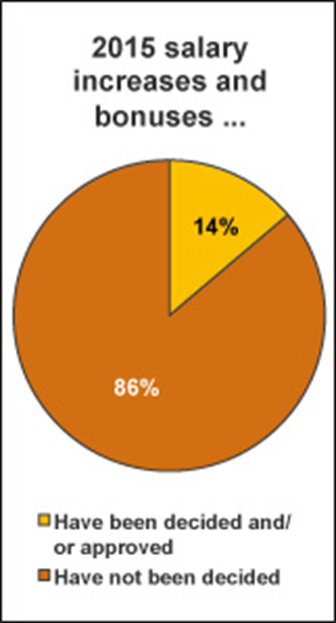
A mere 13.8% (down from 14.1% in 2013) of survey participants have decided and/or approved their pay budgets for 2015, leaving 86.3% undecided as of the end of June.
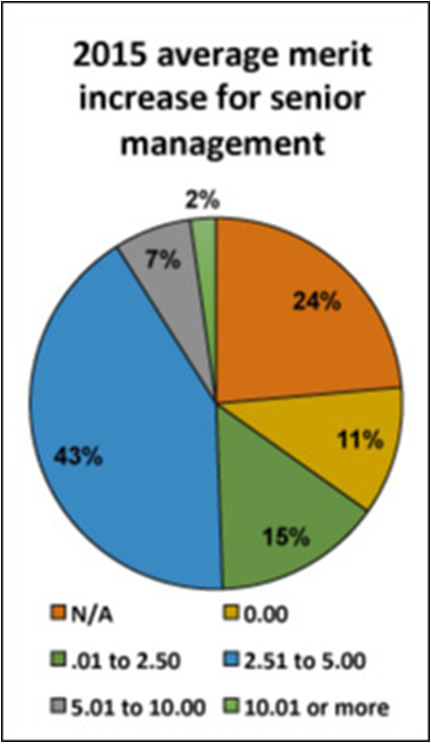
Of those who have decided, on average across all employee types, 14.3% (down from 17.8% last year) of the employers expect to offer 2015 merit increases of up to 2.5%, 48.8% plan no increase, 41.7% (up from 29.6% last year) plan to offer merit increases of 2.5–5%, and 5.2% (up from 3.5% last year) plan to offer increases above 5%.
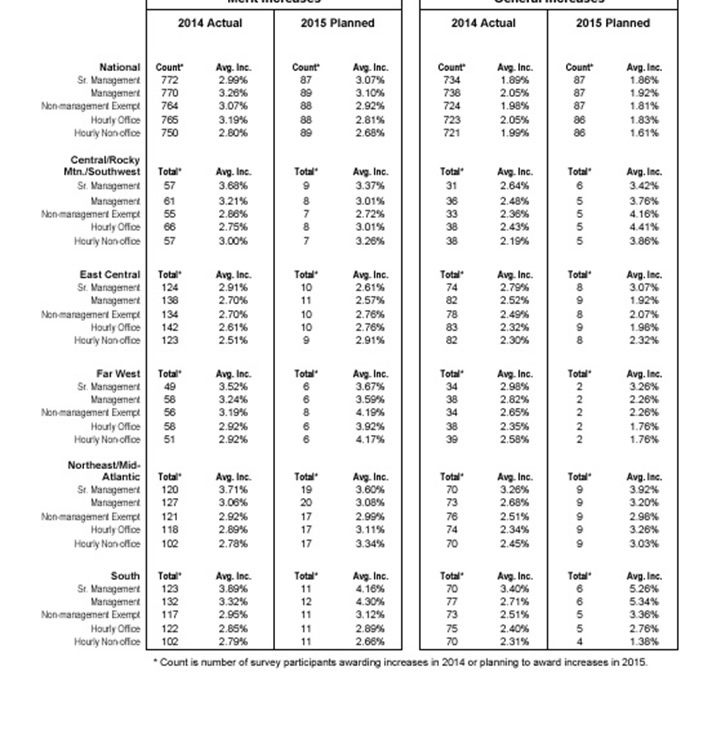
The breakdown of employee types shows 14.9% of employers plan merit increases of up to 2.5% for senior management, 18% plan that amount for management, 13.6% plan it for nonmanagement salaried exempt employees, 12.5% plan the same for hourly office employees, and 12.4% plan to award up to 2.5% of base pay as an increase to hourly nonoffice employees. Among employers planning merit increases for 2015, the most common amount is 2.5–3% for exempt nonmanagement employees and 3.01–3.50% for senior management, management, and hourly nonoffice employees.
Last chance to enter your HR innovation for the HR Innovator Awards. Get recognized for your contributions to the profession. Final deadline for entries is August 30. Details and entry form here.
2015 General Increases
Of those who have decided their pay budget for 2015, on average across all employee types, 16.9% (down from 22.2% last year) of the employers expect to award general increases of up to 2.5%, 15.5% (down from 17.2% last year) plan to offer general increases of 2.5–5%, 5.5% (up from 4.2% last year) plan to award above 5%, and 62.1% (up from 56.5% last year) plan no general increase.
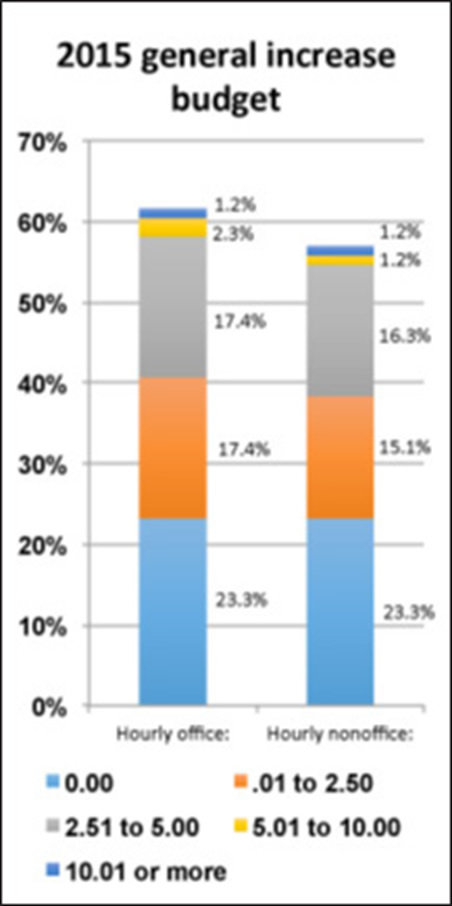
The breakdown of employee types shows 17.2% of employers plan merit increases of up to 2.5% to senior management, 18.4% plan that amount for management, 16.1% plan it for nonmanagement salaried exempt employees, 17.4% plan the same for hourly office employees, and 15.1% plan to award up to 2.5% of base pay as an increase to hourly nonoffice employees. Among employers planning general increases for 2015, the most common amount is 2.51–3% for exempt nonmanagement employees, management, and hourly employees. It is 2.01–2.50% for senior management.
2015 Maximum Individual Increases
Approximately 7.5% of survey participants indicated their plans for maximum individual increases in 2015. Of that group, on average, 16.5% plan to award a maximum increase of up to 2.5% and 31.4% plan a maximum of 2.51–3% as their individual increase while an average of 14.9% plan 5.01–10% of base pay, and 4.6% plan more than 10% of base pay. At 12%, senior management employees are the largest employee group receiving individual increases of more than 10%.
2015 Rate Range Adjustments
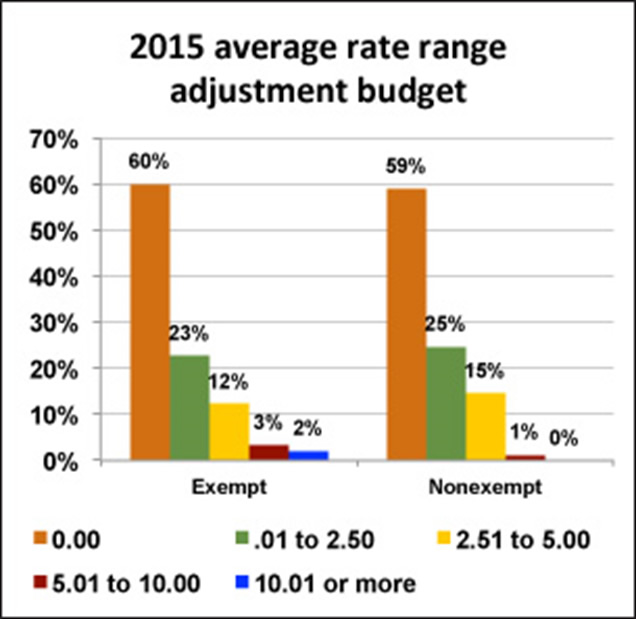
Of the 7.1% of survey participants that answered the question, on average across all employee types, 59.6% (down from 61.9% last year) plan no rate range adjustments for 2015, 23.5% expect to adjust their rate ranges by up to 2.5%, 13.1% expect to make adjustments of 2.51–5%, 2.5% plan adjustments of 5.01–10%, and 1.3% plan adjustments above 10%.
2015 Bonuses
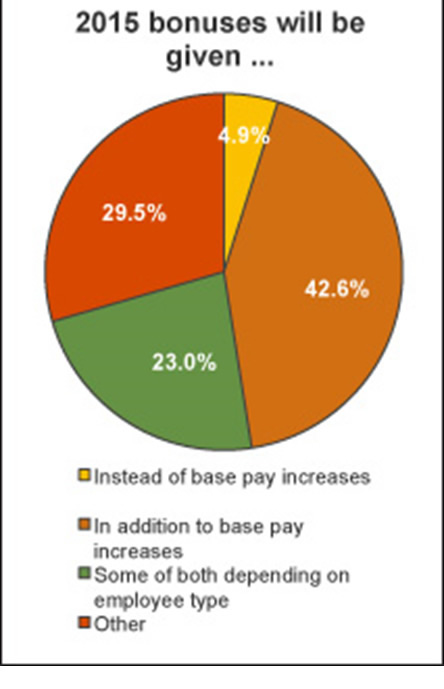
A little under 7% of those responding to our survey provided information regarding their plans for bonuses in 2015. Of those who did, on average across all employee types, 6.3% plan to offer bonuses of up to 2.5% of base pay and 12% plan to offer 2.5–5%. Another 6% plan bonus amounts in 2015 of 5.01–10% and bonus amounts of over 10% are planned for an average of 13.3% of the survey participants who answered this question. Though 4.9% (down from 7.9% last year) plan to award bonuses in lieu of pay increases, 42.6% (up from 34% last year) will award bonuses in addition to salary increases, and 23.9% plan some of both depending on employee type.
Pay Practices
The most important factors that affect pay increases include performance (33.5%), company profits (28.3%), and competitors’ wage rates (7.5%). Coming in at 0.4%, department or division is the least common factor affecting raises.
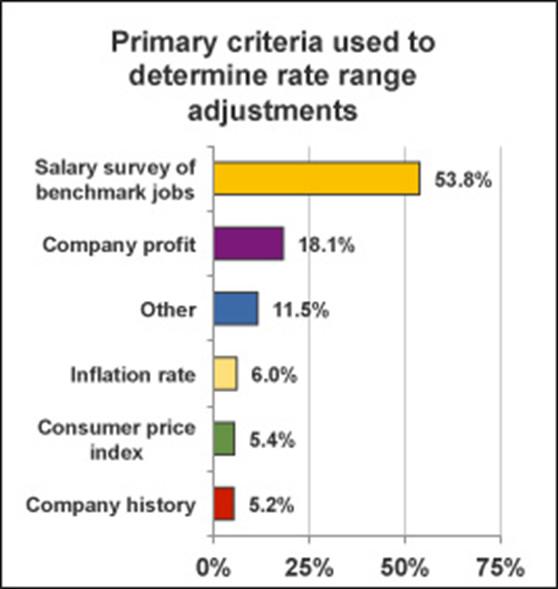
The criteria our survey participants use to determine rate range adjustments include survey of benchmark jobs, at 53.8%, company profit, at 18.1%, inflation rate, at 6%, and consumer price index and company history, at 5.4% and 5.2%, respectively.
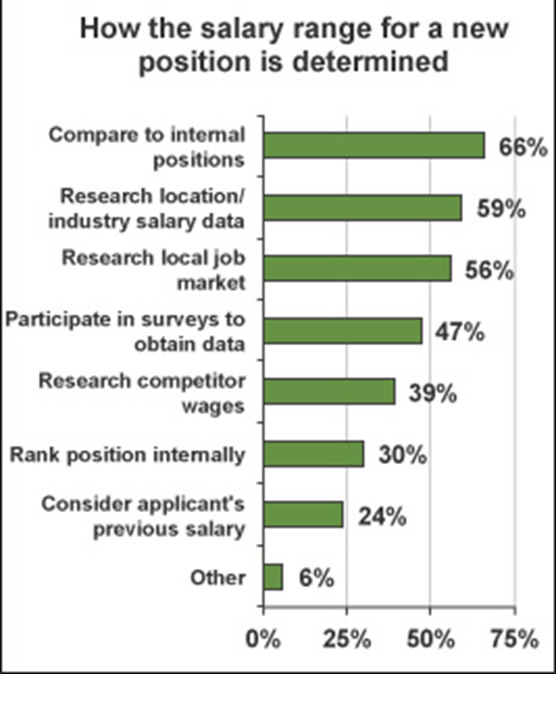
When it comes to assigning a salary range for a new position, our survey participants use a variety of methods. For example, 65.7% compare the new position to other positions within the company and 59.3% research location, industry, and position salary data. Only 23.8%, however, consider the chosen applicant’s previous salary.
Our survey participants use a wide range of sources for salary data, including:
- Trade associations, 21.5%
- Consultants, 15.4%
- Bureau of Labor Statistics, 11.1%
- Salary.com, 9.4%
- BLR, 4.6%
- Economic Research Institute, 3.9%
- Online recruiters, 2.7%
- O-Net Online, 2.6%
- Other, 28.8%
HR professionals fulfill many roles when it comes to setting raises. For example, 7.4% of survey participants who answered this question help supervisors with tough pay decisions and 37% play a major role in deciding the companywide level for raises. Each department’s raises are reviewed by 7.2% and 6.2% approve each employee’s salary increase. Employee raises are determined by 2.4% and 19.1% play no role in setting raises at their organization.
Final deadline for the HR Innovator Awards! Get recognized for your contributions to the HR profession. All entries must be in by August 30. Details and entry form here.
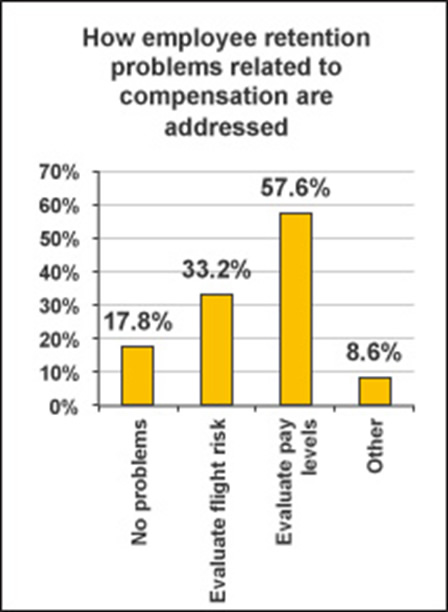
To address employee retention problems, 57.6% evaluate their pay scale/rate range levels to ensure market competitiveness and 33.2% evaluate employees for flight risk, addressing pay issues at the individual employee level. No compensation-related problems are the norm for 17.8% of survey participants.
Participants and Demographics
A total of 1,130 individuals participated in this survey, which was conducted in June 2014. Of those who identified themselves, 56.2% are private for profit, 24.2% are private not-for-profit, and 19.6% are public sector.
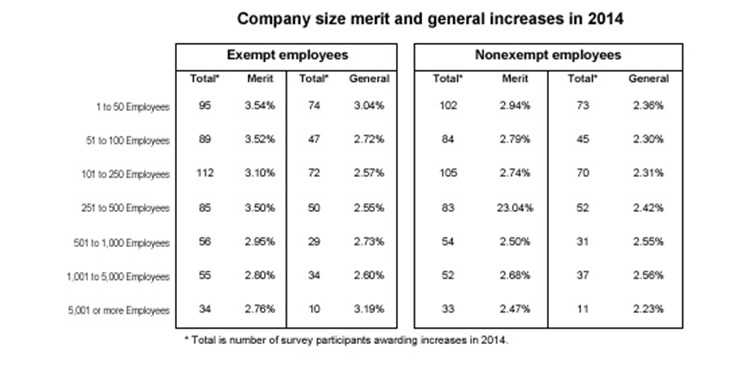
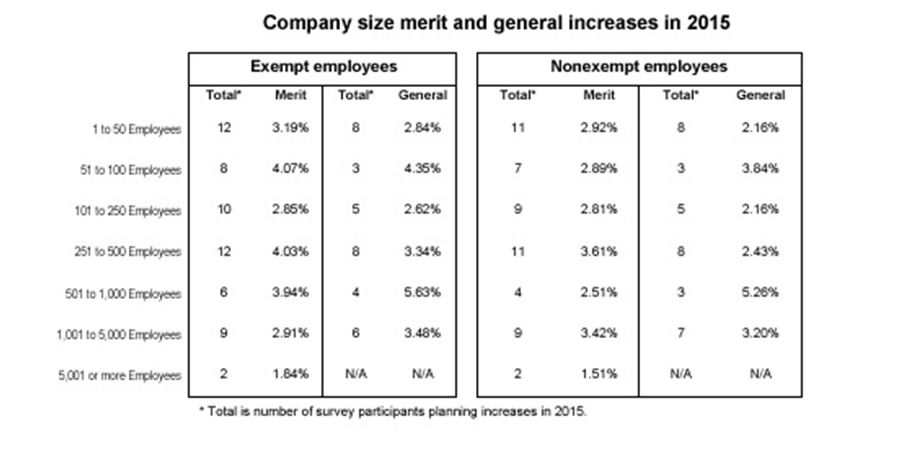
Companies with 1–250 employees are represented by 60.9% of survey participants and organizations with 251–500 employees account for 13.5%. Employers with 501–1,000 employees are represented by 9.2% of survey participants, those with 1,001–5,000 are represented by 10.7%, and organizations with more than 5,000 employees are represented by 5.6% of survey participants.
A hefty 45.3% have a workforce that is 1–25% exempt as defined by the FLSA, 25.6% have a workforce that is 26–50% exempt, and 23.4% have a 50–100% exempt workforce. Only 11.5% of survey respondents have a workforce of more than 50% union employees.
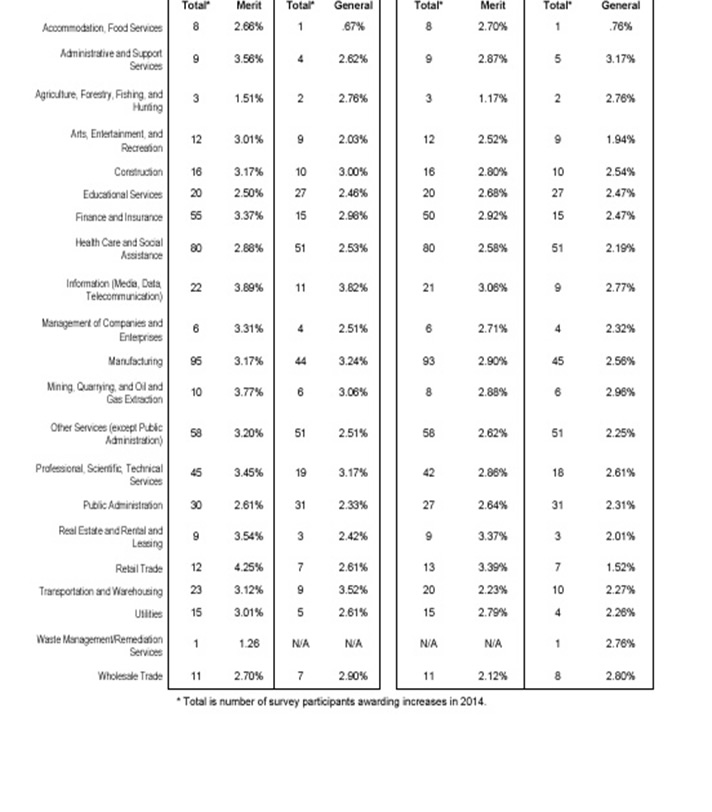
Over half (60.7%) of the participants are in service industries; 21.6% are in agriculture, forestry, construction, manufacturing, or mining; 7.9% are in wholesale, retail, transportation, or warehousing; 2.9% are in real estate or utilities; and 6.9% are in public administration.
Staff-level employees account for 13.9% of the survey participants who self-identified. Supervisors account for 3.5% and managers account for 33.8%. Director-level employees account for 29.6% and vice president or higher round out the field at 19.3%.
Thanks again to all who participated! [See detailed information below.]
Have you found an innovative way to manage total rewards—or any other HR or compensation-related activity?
Final Call: HRDA HR Innovator Awards
Get recognized for your outstanding HR innovations! HRDA’s HR Innovator Awards recognize individuals or organizations who have devised and implemented innovative strategies and techniques for solving HR problems or meeting other HR challenges. Winning entries will have a substantial return on investment or a substantial positive effect on HR operations and productivity. But enter now—the final deadline is fast approaching. Details and entry form here.
The award program is open to any HR practitioner or HR department. What’s in it for you and your organization?
- Demonstrates your desire to be an outstanding HR professional.
- Showcases your and your organization’s innovative thinking.
- Provides recognition—for yourself, within your organization and with your professional peers, and for your organization.
- Enhances your organization’s employer brand.
- Allows you to make a significant contribution to your profession as others are inspired by your innovation.
- Provides positive publicity, as winners will be announced through news media, social media, and to the
- Daily Advisor 240,000 subscriber base.
- Allows use of the winners’ logo.
Want to be recognized? The deadline for entries is upon us. The entry process is clear and straightforward, but you have to do it now before the final deadline of August 30. Details and entry form here.

How can 2015 raises be performance-based if they’re already largely determined, months before 2015 ends?