Our HR Metrics Survey, conducted in April 2015, sought to find out how metrics are being employed in the field of human resources. Everyone knows that the C-suite loves to see hard data—which HR arenas (and what aspects of them) are the most measured? How are metrics used to gauge recruiting success? What metrics were declared the most useful by our respondent pool?
 |
Some Highlights from the HR Metrics Survey:
- The most popular metric among participants was turnover, measured by 78% of respondents. Voluntary vs. involuntary turnover was of particular interest among those polled.
- The least-used metrics were cost per hire and quality of hire—only 28.5% of participants indicated they measured these factors.
- 57.9% of respondents track employee engagement or satisfaction, primarily through interviews/surveys or scores on a questionnaire.
- When it comes to measuring the recruiting experience at their company, participants were more concerned with noting a new hire’s view of the experience than a general applicant’s view of it.
- While respondents were nearly evenly split regarding metrics for training (51% measure it), among those who do maintain metrics, the most popular aspect to measure was the type of training offered (e.g., skills, onboarding, or whether training was mandatory).
Who Responded?
A total of 604 individuals participated in the HR Metrics Survey, representing a diverse array of industries, business types, and locations. Respondents hailed from all across the United States and also the world, with the largest percentage of participants (19.2%) reporting from companies that have a nationwide presence in the United States. 13.2% of participants identified themselves as being employed at non-U.S. or international organizations.
Of those who identified themselves, the majority (61.3%) represent privately owned, for-profit companies; 20.4% are with nonprofit organizations; 12.1% work in the public sector; and government organizations were represented by 6.1% of the response pool.
Managers made up the largest portion of the respondent pool at 51.0%. Executives (defined as VP level or higher) made up slightly over a quarter of those surveyed at 25.1%, and staff-level employees were included as 11.5% of participants. Supervisors made up the smallest group at 3.7%.
HR Metrics are being used in some very interesting ways by HR departments across the country. Learn what your competitors may be up to with our new research report, HR Metrics Best Practices: How Big Data Drives Big Decisions. Learn More.
Cost Per Hire, Time to Fill, and Quality of Hire Metrics
A large majority of participants (71.5%) do not measure cost per hire. Among those who do, the metrics are most commonly broken out by level of the position (which is done by 60.9% of respondents), followed by department or facility (43.8%). Among the other factors by which participants broke out their cost-per-hire metrics were:
- Recruitment fees/sourcing
- Special skills
- Sales vs. nonsales
- HR operating expense

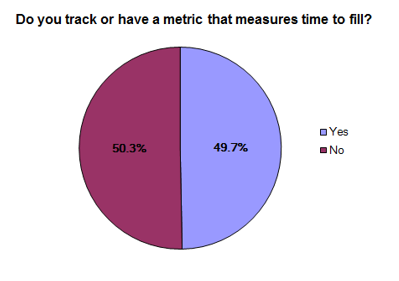
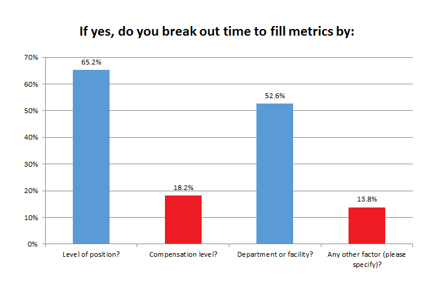
Respondents were almost evenly split on measuring time to fill, with 49.7% tracking the metric as opposed to 50.3% who do not. Only 18.2% of those who track time to fill break out the metric by compensation level, with a stronger preference shown in the response pool for breaking out by level of position and department/facility. Time to fill was also broken down by other factors among 13.8% of participants, including:
- Exempt vs. nonexempt
- Advertisement cost
- Internal vs. external hire
- Past difficulty in filling job
- Urgency of hiring
Only a minority of participants measure quality of hire—28.5%. Of these few who track quality, when they break down the metric they appear to be most concerned with how satisfied the hiring manager is with the new recruit (56.7% look at the metric from this perspective). “Other factors” that influence participants’ analysis of quality of hire included:
- If the new hire passes the probationary period
- Certification requirements
- Percent of required skills met
- Retention and turnover levels
More Recruiting Metrics
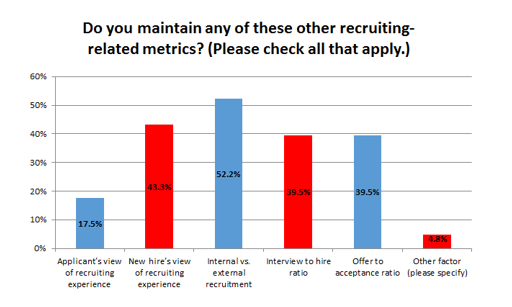
Next, we asked our participants if they tracked any other popular recruiting-related metrics. Internal vs. external recruiting was the most popular, with 52.2% of respondents measuring this factor. Interview-to-hire and offer-to-acceptance ratios were tied at 39.5%, and participants were clearly more concerned with a new hire’s view of the recruiting experience than they were with an average applicant’s view of the process. “Other factors” listed by participants included:
- Candidates submitted to hiring manager vs. candidates interviewed
- Potential hires who fail drug screens
- Sources
- Onboarding
Who Makes Up Your Workforce?
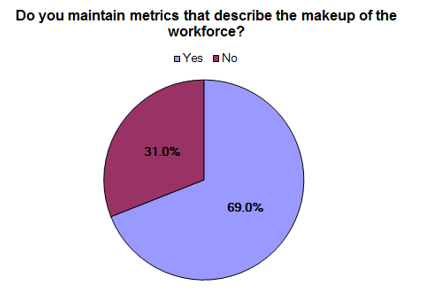
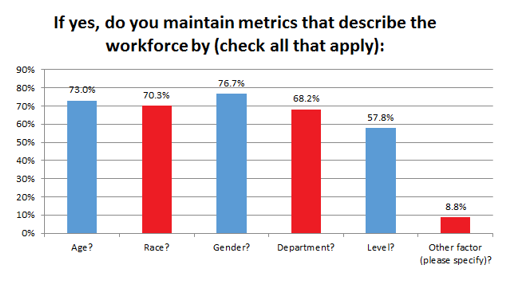
A majority (69%) of participants maintain metrics that describe the makeup of their organization’s workforce, and many of them break the measurement out by factors of gender, age, race, department, and level. Other factors listed by participants included:
- Education
- Tenure
- Veteran and/or disability status
- Nationality
- Union vs. nonunion
- Exempt vs. nonexempt
How do HR departments use the extreme amount of data available these days? It’s all in this report: HR Metrics Best Practices: How Big Data Drives Big Decisions. Click Here.
Measuring Complaints and Legal Issues
First, it should be noted that a great number of participants (368, or 60.9% of the response pool) skipped this question altogether—an indicator that only a minority of them keep metrics for complaints or legal issues in the first place. Of those who do, the most common metric is the number of complaints filed by employees.
Other complaints or legal entanglements measured by participants included:
- Number of union grievances
- Type of complaint
- Unemployment cases protested and won/lost on appeal
- Ethics complaints
- HR compliance audit reporting
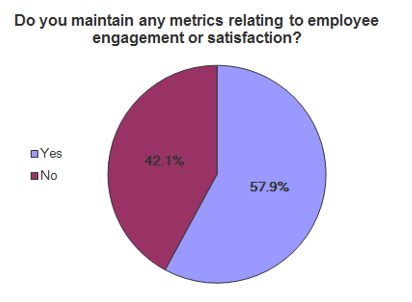
Employee Engagement and Satisfaction
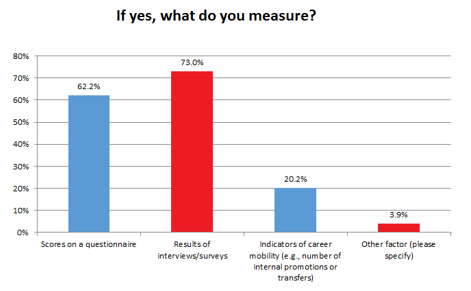
A slight majority of 57.9% responded that they keep metrics relating to employee engagement and/or satisfaction, and they use a variety of methods to track it. The most common way that they measure this is via interviews/surveys (73% use this method), followed by scores on a questionnaire (62.2%). Other methods of measuring engagement and satisfaction that were specified by participants included (among other things):
- Grievances filed
- Attrition and internal rotation percentages
- Engagement activities
- Employee forums
In tomorrow’s Advisor, we reveal more results of our HR Metrics Best Practices Survey. Plus an introduction to our premium survey report.