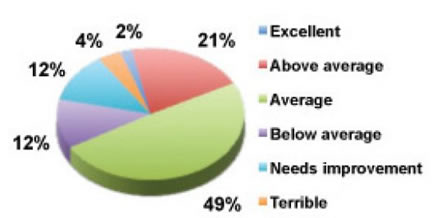
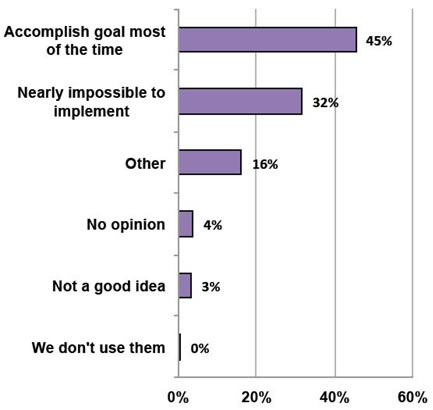
Most everyone does appraisals (94% of respondents) but not everyone thinks they are doing them well (4% say they do a “terrible” job and 32% say appraisals are “nearly impossible to implement”), according to our recent survey of performance management practices.
Some other highlights of the 2013 Performance Management Survey:
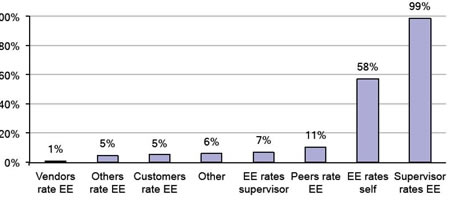
- Employee self-evaluation is part of the process for 58% of respondents and peer evaluation is a best practice for 11%.
- 22% believe that the employees in their organization are pleased with their individual pay-for-performance program.
- 13% impose financial penalties on managers and supervisors who do not get appraisals done on time.
Here are the detailed survey results from the 1358 survey participants. How does your organization measure up?
How Well Do You Do Appraisals?
When asked how well their organizations conduct performance appraisals, a hefty 72% of the participants rate their organizations as average or above:
 |
HR budget cuts? Let us help. HR.BLR.com is your one-stop solution for all your HR compliance and training needs. Take a no-cost, no-obligation trial and get a complimentary copy of our special report Critical HR Recordkeeping—From Hiring to Termination. It’s yours—no matter what you decide.
What Is Measured?
Overall performance is measured by 80% of survey participants and specific attributes are also measured by 48%. Completion of specific goals is a measurement criterion for 51% and our favorite catch-all “other” includes:
- Personality/behavior,
- Professional development/knowledge,
- Core competencies,
- Developmental needs/training completed,
- Cultural fit/personal values, and
- Adherence to organizational values.
Who Rates Whom?
Respondents indicated the following rating relationships (“EE” means “employee”):
 |
Nonexempt employee performance factors
The top 5 factors used when evaluating nonexempt employee performance are:
|
Quality |
90% |
|
Attitude/cooperation |
74% |
|
Communication skills |
71% |
|
Attendance and punctuality |
69% |
|
Dependability/reliability |
68% |
The 5 least used factors in nonexempt employee performance appraisals are initiative (56%), safety (42%), flexibility (40%), resourcefulness (31%), and creativity (26%).
Flagged by 16% of survey participants, the “other” basket included performance factors such as:
- Judgment
- Passion
- Integrity
- Innovation
- Respectfulness
- Loyalty
- Adaptability
- Boldness
- Initiative
- Sensitivity
- Problem solving
What’s Your Take on Appraisals?
Not all respondents are positive about appraisals.
 |
Exempt Employee Performance Factors
The top 5 factors used when evaluating exempt employee performance are:
|
Communication skills |
78% |
|
Job knowledge |
74% |
|
Achieving goals |
71% |
|
Leadership ability |
66% |
|
Decision-making ability |
66% |
The 5 least used factors in exempt employee performance appraisals are staff development (45%), attendance/punctuality (44%), financial management (37%), creativity (36%), and staff utilization (27%).
The “other” basket (14%) for exempt employee performance factors includes:
- Strategic agility
- Business acumen
- Courtesy
- Inclusion
- Entrepreneurship
- Holistic thinking
- Presence
- Change management
- Persistence
- Innovative mindset
- Integrity
- Contribution to profit
- Continuous learning
- Building positive relationships
- Business ethics
- Collaboration
- Staff development
- Employee engagement
Evaluation Process
Not surprisingly, supervisors evaluating employees is the norm for 99% of survey participants. Employee self-evaluation is part of the process for 58% however, and peer evaluation is a best practice for 11%. Subordinates evaluating supervisors is an option for 7% of survey participants, and 5% have a mechanism in place for customers to evaluate employees.
When asked which employee groups do not receive evaluations, 34% indicated that temporary employees’ performance is not formally reviewed. Senior management/executives are not reviewed by 23% and part-time workers do not receive performance reviews at 12% of survey participants’ organizations.
Frequency/Timing
Performance appraisals are conducted annually for 51%. They are conducted after the first 90 days and then annually thereafter for 23%. Reviews are every 6 months for 12% of survey participants and 3% have no firm schedule. The “other” basket for this question reveals quite a few options, including:
- Annually with a mid-year check-in
- Annually with quarterly check-in
- After first 30 days, after 90 days, then annually
- After 45 days, after 90 days, then annually
- Quarterly
- After first 90 days, after 6 months, then annually
- As needed
- When an employee is recommended for termination
- After first 2 years, then at 3 years, then at 5 years
- After 30, 60, 90, 180 days and annually from start date after that
New employees receive their first performance review after 6 weeks on the job for 6% of survey participants and after 3 months for 45%. Newbies get their first review after 6 months for 17% and after 9 months for 1%, while 17% receive their first indicator of success or failure after a full year of employment.
A common review date is utilized by 56% of participants and a variation of common review dates (e.g., common dates staggered by groups) is used by 7%. Appraisals are spread out over the year for 25%, and a combination of common date and scattered dates throughout the year is used by 9% of survey participants. Conducting all reviews at the same time is preferred by 47%, and 28% prefer that they be spread throughout the year. A combination is preferred by 17%, and 8% had no opinion one way or the other.
The frequency with which individual pay-for-performance plans are aligned with organizational objectives and strategies is annually for 59% and biannually for 1%. Alignment is intermittent with no set schedule for 11% and never (as far as they know) for 24% of survey participants.
Forms and Tools
Basically the same form is used for all or almost all employees at the organizations represented by 46% or our survey participants. Different forms for different departments or positions are used by 18% and different forms for exempt vs. nonexempt are used by 14%. Management appraisals are conducted using a different form than the one used for nonmanagement employees by 15%, and 2% have no standard form.
Appraisal forms with ratings/scales work well for 78%, and essay questions work well for 24%. Multiple choice review statement/questions work well for 13%, and 7% like yes/no statements/questions.
Performance review software is not an option for 62% of survey participants, and 11% have no performance appraisal software but are interested in learning more about it. Software is used by 12% with good results but using it hasn’t improved the process for another 8%. A small group, (1%) have looked for such software but not found anything that meets their needs.
When it comes to what kind of software is used, the responses in our survey are all over the map. Success Factors is used by 14%, eAppraisal is used by 8%, and Taleo Perform is used by 4%. The largest group is the “other” basket at 62%. It contains over 35 different software options with in-house developed software leading the pack at 7%, followed by PeopleSoft and ADP® at 4% each.
Employees’ Role
When setting individual performance pay factors, employees are heavily involved for 7% of our survey participants and somewhat involved for 18%. They are minimally involved for 18% and not involved at all for 52%. For 49% of our survey participants, employees have sufficient impact on individual performance factors that impact their pay and for 36% they do not. The remaining 15% are not sure.
When asked if they thought employees in their organization would agree that they have sufficient impact on individual performance factors that impact their own pay, 22% believe they would agree and 46% believe they would not. The remaining 32% are not sure one way or the other. Along those same lines, 22% believe that the employees in their organization are pleased with their individual pay-for-performance program, 42% do not, and 36% are not sure.
Supervisors’ Role
Management’s top responsibilities when it comes to performance evaluations are writing evaluations of their direct reports (84%), followed closely by conducting review meetings (78%), setting goals for/with employees for 77%, and coaching employees for improved performance for 74%. Finishing out the field is reviewing evaluations prepared by direct reports for their own employees (66%), deciding employee salary raises (51%), and providing input to other supervisors on their direct reports (38%).
The 3 worst errors supervisors (or other evaluators) make are not following up with employees after the review to check on progress (41%), placing all employees in the middle of the scale (39%), and focusing only on the most recent performance (39%).
As a general rule, supervisors are not held accountable when they do a poor job of managing the performance appraisal process. Rarely (35%) do supervisors receive disciplinary action or a poor mark on their own evaluations for doing a poor job and 37% never do. Correspondingly, training for evaluators is never conducted at 31% of survey participants’ organizations and only for new supervisors at 26%. Training, however, is conducted annually at 27% and more often at 6%.
The top five methods used to motivate supervisors and managers to conduct accurate and/or timely evaluations include:
- Sending frequent reminders, 19%
- Sending Outlook appointments two weeks ahead of the due date
- Follow-up calls to keep them accountable
- Reminder e-mail and compliments on appraisals done well
- Providing training on the performance review process, 15%
- Giving tips, conducting group or one-on-one trainings
- Learning courses and workshops
- Creating a newsletter with advice on how to conduct reviews
- Imposing financial penalties, 13%
- Holding their own evaluation (and subsequent increase) hostage
- Holding everybody’s pay increase hostage until all evaluations are completed
- Bonus payout contingent on completing appraisals in a timely manner
- Setting deadlines, 10%
- Setting realistic time frame and goals for completion
- Setting a performance review calendar for reviewers to follow
- Set a closing date for submission
- Using cultural pressure, 10%
- Posting a completion rate chart
- Copying senior management on reminder notices
- Senior management support
HR’s Role
HR’s primary responsibilities regarding performance appraisals include filing the paperwork (60%), informal coaching for supervisors/evaluators (59%), reviewing all evaluations (52%), and providing formal training for supervisors/evaluators (51%). Additionally, 37% provide input to evaluators.
HR screens performance evaluations for anything that might be illegal before supervisors/evaluators meet with employees at 37% of the organizations represented by our survey participants, and they sometimes screen review forms at 20%.
Performance and Pay
Evaluations are tied to most salary increases for 45% of survey participants and partially tied to salary increases (e.g., tied to merit increases but not cost of living increases) for 32%. Evaluations and increases are completely separate for the remaining 23%. The top 5 reasons survey participant organizations separate evaluations from increases are:
- To focus attention on performance instead of pay raises, 33%;
- To avoid an entitlement mentality among employees, 27%;
- Appraisals are more valuable and constructive if not tied to raises, 19%
- Budget constraints, 18%; and
- To keep evaluators from inflating appraisals so employees receive higher raises, 17%.
When there will be no salary increases (due to a salary freeze or some other reason), however, supervisors/evaluators still give performance evaluations at 83%.
Pay for Individual Performance
Survey participants indicate the most common individual performance pay received by executives includes bonuses, 53%; merit increases, 43%; and long-term incentives, 19%. Individual performance pay received by middle management includes merit increases, 50%; bonuses, 48%; and long-term incentives, 5%. Individual performance pay received by professionals includes merit increases, 50%; bonuses, 38%; and long-term incentives, 5%.
 |
Pay for Group or Team Performance
When it comes to team performance pay, executives receive bonuses 26%, merit increases 14%, and long-term incentives 9%. Group performance pay received by middle management includes bonuses 23%, merit increases 15%, and long-term incentives 3%. Team performance pay received by professionals includes bonuses 19%, merit increases 16%, and commissions 2%.
The most common team performance pay plan, however, is no group plan for all of the above employee types:
- Executives, 65%
- Middle management, 67%
- Professional employees, 69%
- Exempt employees, 69%
- Nonexempt employees, 70%
Appraisal Alternatives
Not every employer conducts performance appraisals and, when asked what they do instead, survey participants indicated the following alternatives:
- Nothing;
- Annual across-the-board adjustments;
- Manage, monitor, and give performance feedback as required; and
- Performance log, which provides continuous performance documentation.
Survey Participants
Company size of respondent companies
| Up to 250 employees |
55% |
|
251 to 1,000 employees |
23% |
|
1,001 to 10,000 employees |
18% |
|
More than 10,000 employees |
4% |
Of the participants responding to our survey, 37% have a workforce that is one-fifth or less exempt employees. Another 35% have a workforce that is more than one-fifth but less than one-half exempt employees, and 28% have a workforce with more than one-half exempt employees. Unions represent employees at 23% of our survey participant employers.
Privately owned organizations are represented by 56% of survey participants, and nonprofits account for 22%. Public corporations make up 11%, and governments are represented by 10%.
Industries of responding companies include
| Manufacturing |
18% |
|
Health care and social assistance |
14% |
|
Finance and insurance |
10% |
|
Professional, technical, and scientific services |
9% |
|
Educational services |
7% |
|
Retail trade |
3% |
Job titles of 1358 survey participants
| HR VPs or above |
8% |
|
HR Directors |
18% |
|
HR Managers |
19% |
|
HR Generalists |
7% |
|
HR Coordinators |
3% |
|
HR Specialists |
3% |
|
Other areas with HR responsibilities |
13% |
|
Other |
29% |
Thanks to all 1358 participants in our survey!
Next survey topics include:
- HR Policies
- Your HR Department
- Employee Leave
- Holidays

this article is very useful and informative