In yesterday’s Advisor, we presented results from our 2014 Recruiting and Retention Survey. Today, more findings from this timely study, including practices for new hires and preferred methods of retention.
 |
A total of 919 individuals participated in this survey, conducted in November 2014.
New Hire Programs
Getting new employees on board is formalized for 88.4%. It is an ongoing process during the first 1 to 3 months of employment for 22.3% and is 1 to 2 hours of orientation for 18.3%. Multiple sessions spread across several days within the first week of employment is the norm for 17.4% and a single, full day is the process for 10.7%. A half-day is utilized by 16.1%. Benefits enrollment occurs during orientation for 36.2%. It is during the first week of employment for 17% and during the first month for 25.5%.
Management team members participate in the onboarding process for 75.3%. Training on how to successfully onboard new employees is received by 46.8% (up from 38.3% in 2013) and mentors or buddies for new employees are provided by 43.2%.

Retention
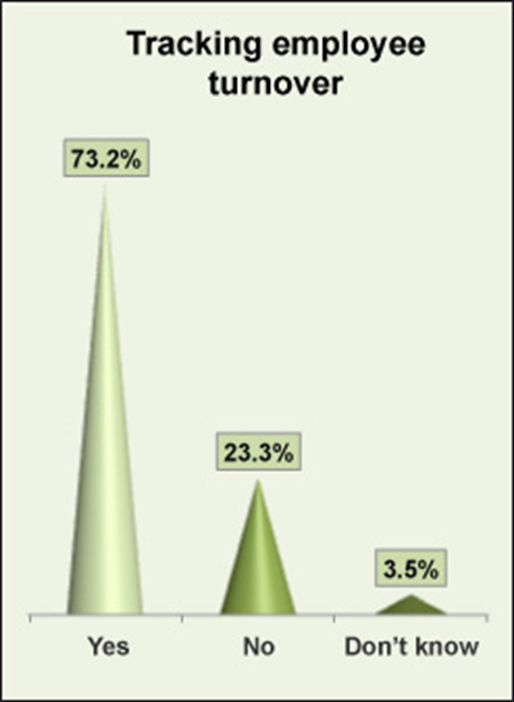
Employee turnover is tracked by 73.2%, with management turnover at 1% to 10% for 38.6% and for professionals it’s the same rate for 37.1%. Turnover of mid-level employees is below 10% for 37.1% and 11% to 25% for 15.6%. The rate of turnover for entry-level employees is under 10% for 25.8% and 11% to 25% for 18.5%.

This survey looked at retention from two different perspectives. First, we asked participants to select the options they use to retain qualified employees from a list of common practices. Here are their top 10 selections:
|
1 |
Adequate benefits |
83.6% |
|
2 |
A safe, healthy work environment |
69.4% |
|
3 |
Fair and equitable treatment |
61.3% |
|
4 |
Training and development opportunities |
60.6% |
|
5 |
Pay at or above market rate |
55.1% |
|
6 |
Employer trust, respect, and consideration |
51.5% |
|
7 |
Opportunity for advancement |
51.2% |
|
8 |
Appropriate and fair discipline for rule breakers |
50.9% |
|
9 |
Engagement between employers and managers |
49.7% |
|
10 |
Incentives such as bonuses and profit-sharing, |
49.1% |
Next, we asked survey participants to select, from the same list, which practices are most effective when it comes to retaining employees. Here’s the top 10:
|
1 |
Adequate benefits |
67.6% |
|
2 |
Pay at or above market rate |
65.2% |
|
3 |
Employer trust, respect, and consideration |
65.3% |
|
4 |
Fair and equitable treatment |
63% |
|
5 |
Effective management |
58.6% |
|
6 |
Engagement between employers and managers |
57.9% |
|
7 |
Opportunity for advancement |
57.3% |
|
8 |
Training and development opportunities |
52.2% |
|
9 |
Performance recognition and reward |
50.9% |
|
10 |
Work/life balance through telecommuting, flextime, etc. |
50.1% |
As you can see, many of the selections were the same and, realistically, to be expected. What might not be expected, however, is what’s different. For example, a safe and healthy work environment came in second for methods used but didn’t make the cut for what works to retain employees. Also, the items that came in tenth show that cash incentives are used but providing work/life balance is more effective.
Survey Participants
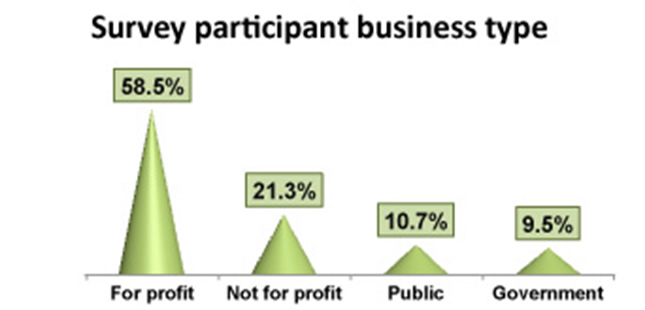
A total of 919 individuals participated in this survey, which was conducted in November 2014. Of those who identified themselves, 58.5% represent privately owned companies, 21.3% are with nonprofit organizations, 10.7% are with public entities, and 9.5% work for government organizations.

The majority (56.2%) of our survey respondents provide HR services to a workforce of 1 to 250 employees. Another 14.3% provide guidance to 251 to 500 employees at their organizations and 11.3% have a workforce of 501 to 1,000 employees. Companies with more than 1,000 employees account for 18.3% of survey participants.
A little below 25% of survey respondents (24.1%) have a workforce that is more than 50% exempt employees. As for unions, less than 10% of the employers surveyed have a workforce that is 50% to 100% unionized and 85.5% have a workforce where less than 25% are union employees.
Over half (65%) of the participants are in service industries; 21% are in agriculture, forestry, construction, manufacturing, or mining; 10% are in wholesale, retail, transportation, or warehousing; and 3% are in real estate or utilities.
Managers account for 54.6% of the survey participants who self-identified, VP or higher make up 23.5%, supervisors are 5.7%, and staff-level employees round out the field of survey participants at 16.1%.
Thanks again to all who participated!Over half (65%) of the participants are in service industries; 21% are in agriculture, forestry, construction, manufacturing, or mining; 10% are in wholesale, retail, transportation, or warehousing; and 3% are in real estate or utilities.
Managers account for 54.6% of the survey participants who self-identified, VP or higher make up 23.5%, supervisors are 5.7%, and staff-level employees round out the field of survey participants at 16.1%.
Thanks again to all who participated!
Want to see more of our results, plus demographic breakdowns for each question? It can all be found in the HR Daily Advisor’s new premium research report, Recruiting Best Practices: Finding and Attracting Talent in 2015’s Challenging Business Climate.
Recruiting is changing at a rapid pace. Some organizations are abandoning traditional methods for social media; some think software can do a better job than people. See the results of our national survey as well as demographic breakdowns for each question.
Available in both print and downloadable PDF versions.
Recruiting strategies? Onboarding practices? What’s working in retention? It’s all in this report: Recruiting Best Practices: Finding and Attracting Talent in 2015’s Challenging Business Climate. Click Here
Among the features of this new product:
- Results from our national survey on recruiting best practices
- Further results of a supplemental survey on recruitment metrics and costs
- National data from the main survey broken down by key demographics
- Summaries and highlights
- And much more!
Don’t be left in the dark! With the information in this report, you will get a feel for what’s working out there—and maybe learn a little about what your competitors might be up to.
