Tag: Survey Participants

Telecommuting and Dress Codes (Survey of 2,000 HR Pros)

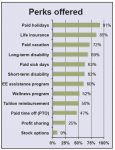
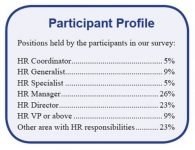
In yesterday’s Advisor, we featured survey results (from 2032 participants) on standard and nonstandard perks. Today, data on telecommuting and dress codes, plus demographic data concerning survey participants. [For the beginning of the survey report, go here.] Telecommuting Formal telecommuting guidelines are in place and employees are required to sign a formal agreement for 23.8%. […]

Survey Results: Telecommuting Policies and Dress Codes

[For the beginning of the survey report, go here.] Telecommuting Formal telecommuting guidelines are in place and employees are required to sign a formal agreement for 23.8%. An allowance to cover employee expenses for setting up telecommuting at their home is provided by 33.1%, 40.3% reimburse telecommuting employees for monthly Internet connections, and 54.2% reimburse […]

Recruiting Survey Results: How Do You Compare?

We garnered an impressive 1,379 participants in this year’s survey, which was conducted in November 2013. Here are the detailed survey results. How does your organization measure up? What Recruiting Methods Are Used? When asked which methods are used to recruit for open positions, online recruiting leads the pack at 79.7%, followed closely by employee […]

Holidays Survey Results in; How Do You Measure Up?

    Thanks to all 3,804 participants! Here are the detailed survey results. How does your organization measure up? 2013 Holiday Season Thanksgiving When asked which days will be paid holidays for their employees at Thanksgiving in 2013, 95.5% of survey participants indicated that Thanksgiving Day will be a paid holiday. Additionally, 65.1% will provide […]

Perks, Insurance, and Atypical Benefits–How Do You Compare?

  Beyond health insurance and retirement benefits (covered in previous surveys), the number one perk provided by the employers responding to our survey was paid holidays, with 91% percent of them offering it. Other highlights: Flextime is offered by 53% of respondents. About 33% relax their dress code in the summer, at least for some […]

Retirement Survey Results–How Do You Compare?

Only 33% of those who answered the question, however, automatically enroll employees, though 2.5% plan to implement auto-enrollment in the future. Other survey highlights: Most common match amount is up to 6% of salary (25% of respondents). Nearly half (48%) of employers offer more than 15 investment options. 26% plan to add a defined contribution […]

Health Care Survey Results in; How Do You Compare?

Wide range of costs per employee ranging from under $3,000 to over $10,000 per year 22 percent still cover 100% of insurance costs; an additional 46% cover at least 75 percent of costs 25% have considered dropping health benefits as a result of Affordable Care Act Here are the detailed survey results. How does your […]