Social media policies pose the greatest problem for responding companies for the second straight year, followed by BYOD (bring your own device) and leave policies, according to the 1,532 respondents to BLR’s 2013 Policies Survey.

Other findings:
Policies Survey Says … Social Media Is Biggest Hassle
- The biggest stumbling block to enforcement of policies is management team members’ tendency to enforce only “some” policies.
- The policy violation most indicated as warranting discipline but not termination is attendance and punctuality.
- The most common termination-level offense is violation of the weapons/violence policy.
Our 2013 Policies Survey reveals that 93% of participants have formalized policies. Of those, the most widely implemented policy, once again, is antiharassment and/or antidiscrimination.
Other commonly held policies include discipline/termination at 90.6%, computer and Internet use at 90.3%, and employee leave at 90%. Coming in last is Bring Your Own Device (BYOD) at 11.6%.
The catchall category “other” included everything from bullying to whistleblower to code of conduct, vehicle use, lactation accommodation, evaluations, injury/illness prevention, tuition reimbursement, smoking, and travel.
HR budget cuts? Let us help. HR.BLR.com is your one-stop solution for all your HR compliance and training needs. Take a no-cost, no-obligation trial and get a complimentary copy of our special report Critical HR Recordkeeping—From Hiring to Termination. It’s yours—no matter what you decide.
Do You Have a Policy on …?
|
2012 |
2013 |
|
| Harassment/Discrimination |
94.5% |
94.6% |
| Discipline/Termination |
90.6% |
|
| Computers/Internet |
90.9% |
90.3% |
| Employee leave of absence |
91.1% |
90.0%* |
| PTO/Vacation |
90.1% |
|
| FMLA (Family and Medical Leave Act) |
81.1% |
|
| Attendance and punctuality |
88.8% |
89.4% |
| Confidentiality/Proprietary information |
90.5% |
88.2% |
| Eligibility for benefits |
89.0% |
86.2% |
| Employment at will |
85.6% |
83.5% |
| Substance abuse |
81.5% |
83.1% |
| Dress code/Personal appearance |
82.8% |
82.6% |
| Ethics/Conflicts of interest |
82.1% |
80.8% |
| EEOC |
78.5% |
|
| Work rules |
76.2% |
|
| Military/Reserve leave |
75.1% |
75.9% |
| Weapons/Violence |
69.7% |
|
| Background checks |
67.1% |
67.9% |
| Travel |
65.4% |
|
| E-mail/Voice mail |
64.3% |
|
| Respectful workplace |
61.8% |
|
| Cell phone/distracted driving |
61.7% |
59.7% |
| Solicitation |
59.6% |
59.1% |
| Social media |
44.4% |
54.2% |
| Training |
44.2% |
51.1% |
| Privacy/Search |
50.9% |
|
| Antinepotism |
36.7% |
|
| Reductions in force |
32.5% |
31.7% |
| Telecommuting |
27.4% |
25.9% |
| Bring Your Own Device (BYOD) |
11.6% |
|
| Other (please specify) |
9.7% |
7.2% |
* Three categories in 2012, one in 2013
Who Is Involved in Policy Development?
Policy development falls squarely on the shoulders of HR management for 84% of our 2013 survey respondents (up from 81.8% last year).
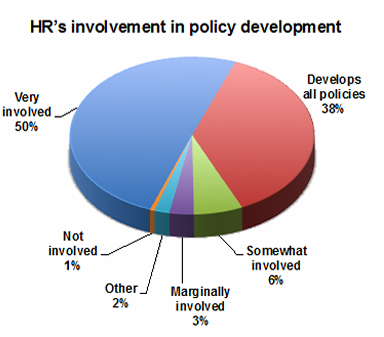
Senior management involvement in policy development is down, however, with 54.1% participating this year versus 59.3% in 2012.
Senior management “develops all policies” for 5.8% (7.2% in 2012) of the survey respondents’ organizations and is “very involved” in policy development for 49.7% (50.3% in 2012). This group is “marginally or somewhat involved” for 40.2% (37.5% in 2012) of the organizations represented and “not involved” for 2.8% of them (2.6% in 2012). For 56.3%, though, senior management has final approval of policies (down from 64.4% in 2012).
Mid-management is “very involved” in developing policies for 12.3% (up from 10.6% in 2012) of our respondents, “marginally or somewhat involved” for 64.4% (down from 68.2% in 2012), and “not involved at all” for 21.3% (up from 19.6% in 2012).
Outside legal counsel has a hand in the process for 24.6% this year compared to 25.7% in 2012 and in-house counsel has a say for 16.4% as opposed to 13.4% in 2012.
“Other” involvement includes policy committees and union contracts as well as boards of directors and government regulations.
For organizations that use outside resources other than legal counsel, 60.9% (65.9% in 2012) use information from trade associations to develop their policies. Also, 43% (45.1% in 2012) use government resources, and 37.5% (42.2% in 2012) use commercial vendors. Using HR consultants to develop policies trails the group with 24.4% (24.5% in 2012).
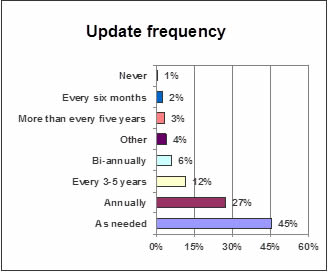
How Often Are Policies Updated
When asked how often policies are updated, 45.4% of survey respondents indicate they update policies as needed, and 27.3% state they update policies annually.
Which Policies Are Next in Line for Updating?
Social media policies were uppermost in the minds of 50% of our 2012 survey participants when asked which policies were next in line to be updated, but that has changed dramatically, presumably because those policies were written in 2012.
Policies in line for update:
| Employee leave | 34.6% |
| Social media | 34.5% |
| Benefit eligibility policies | 27.1% |
| Attendance/Punctuality | 25% |
| Discipline/Termination | 23.6% |
| Computers/Internet | 22.6% |
| Background check | 22.3% |
| Antiharassment/ Antidiscrimination | 22.1% |
| Cell phone/Distracted driving | 21.1% |
Policies scheduled for review by 10 to 20% of survey participants include everything from Bring Your Own Device (BYOD) to weapons/violence. At the bottom of the list, however, are antinepotism at 7.4% and reductions in force just above it at 7.6%.

What Are the Problem Policies?
When asked which policy might become a problem in the next year, 32.4% indicated their social media policy would create the biggest challenge. Trailing the pack is anti-nepotism for 4.1%, the EEOC for 2.2%, employment at will for 1.8%, military/reserve leave for 1.3%, and solicitation for 1%.
Top 5 Problem Policies
|
Rank |
2012 |
|
2013 |
|
| 1 | Social media | 41.7% | Social media | 32.4% |
| 2 | Attendance/Punctuality | 17.4% | Bring Your Own Device (BYOD) | 21% |
| 3 | FMLA and Computers/ Internet (tied) |
15.9% | LOA, FMLA, PTO/Vacation | 15.0% |
| 4 | Background checks | 15.6% | Eligibility for benefits | 14.3% |
| 5 | Eligibility for benefit | 14.7% | Computers/ Internet |
12.9% |
Approach to Implementation
Though some policies are specific to exempt employees for 22% and some are specific to nonexempt employees for 25.4%, all policies apply to all employees for 61.9%. Breaking this down even further, some policies are specific to office employees for 12%, and some are specific to operations employees for 15.9%.
No translation is provided by 87.9% of participants. Handbooks are translated into Spanish, however, by 5.8%; into other languages by .9%; and translated into Spanish as well as another language by 2.1%.
How Are Policies Distributed?
| Employee handbooks | 55.4% |
| Internal website (intranet) | 35.4% |
| 10.5% | |
| 3.7% distribute their policies via loose-leaf memo | 3.7% |
| Do not distribute handbooks or written policies to employees | 1% |
“Other” responses included:
- Employees are told where the policy book is, and they are encouraged to read through it.
- Annual meeting/PowerPoint® presentations.
- Learning Management System mandatory courses.
- Sent to employees when asked.
- Posted on bulletin board.
- Employee agreement has some rules and policies.
- What are you talking about, employee handbook?
- Shared Google doc.
- Employee communication board.
- We use all of the above randomly; handbooks are outdated.
- Policy handbook that is changed verbally.
Some are quite thorough when distributing policies to employees. For example:
- “We distribute them in all possible ways: employee handbook, e-mail, internal website or intranet, internal training, loose-leaf memos.”
- “A paper copy is distributed for reference, the Subject Matter Expert trains the employees on the content, each employee signs an acknowledgement that they have received the training, and the acknowledgement is placed in employee’s file. They can access the information on our intranet or the physical copies (maintained in compliance with ISO standards).”
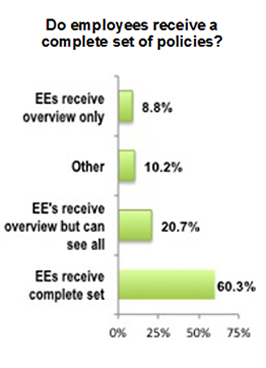
Managers and supervisors receive a separate policy and procedure manual from the handbooks/policies that employees receive for 23.3% of survey respondents but do not for 69.5%.
An employee’s receipt of handbook acknowledgement is required by 81.9% of survey participants, with 19.9% acknowledging that they received the handbook and 62% acknowledging that they not only received it but read it as well. Surprisingly, only 10.7% require employees to turn in outdated handbooks.
Biggest Stumbling Blocks
What are the biggest stumbling blocks to enforcement of policies?
| Management team members’ tendency to enforce only “some” policies | 67.9% |
| Need to update policies | 30.5% |
| Having policies that are difficult to understand | 11.8% |
| Retaining policies that should be canceled | 11.6% |
| Inadequate or lack of distribution | 9.7% |
Progressive discipline is utilized for some violations of policy for 59% and for all policy violations for 30.1%. It is never utilized, however, for 5.6%.
Always following through with discipline for policy violations is the norm for 13.6% of survey participants, though violations are hardly ever disciplined for 8.1%. Policy violations usually result in discipline for 27.2%, frequently for 22.1%, and sometimes for 25.6%.
Most Frequent Policy Violations Warranting Discipline
Respondents indicated the following policy violations most indicated as warranting discipline but not termination:
| Attendance & punctuality | 63.7% |
| Dress code & personal appearance | 59.2% |
| Misuse of computers and/or the Internet | 40.1% |
| Violation of work rules | 39.9% |
| Respectful workplace | 36% |
When it comes to termination-level offenses, however, violation of weapons/violence policies tops the list for 62.6% of survey participants, followed closely by violation of antiharassment and antidiscrimination policies for 60.3%.
Survey participants indicated that more successful enforcement of policies could be enhanced by:
- More training—35%
- More consistent implementation and/or discipline—20%
- Greater support from management team members—12%
- Accountability for the management team—9%
- Better communication of policies—9%
Survey Participants Demographic Data
A total of 1,532 organizations participated in this survey, which was conducted in July 2013. Of those who identified themselves, 53.7% are privately owned, 10.5% are public entities, and 27.3% are government or nonprofits. Companies with 1 to 250 employees account for 59.4% of survey participants. Companies with 251 to 500 employees make up 14% and organizations with 501 to1,000 comprise 8.7%. Rounding out the group, companies with more than 1,000 employees account for 17.8% of survey participants.
Less than 8% of the employers surveyed have a 50 to100% unionized workforce. Also, 85.1% have a workforce that is less than 10% union employees. Less than 24% of the respondents have a workforce of more than 50% exempt employees.
Just over half (50.3%) of the participants are in service industries; 23.2% are in agriculture, forestry, construction, manufacturing, or mining; 7.5% are in wholesale, retail, transportation, or warehousing; and 18% are in real estate, utilities, or “other.”
Comp and benefits professionals account for 2.4% of the survey participants who self-identified, other human resources professionals make up 79.1%, and 18.6% are in other areas with HR responsibilities.
Thanks to all who participated in the survey! Upcoming survey topics include:
- Your HR department
- Employee leave
- Holidays