Yesterday’s Advisor presented some of the findings of our reader survey on HR metrics best practices. Today, we present more results of the study, including measures of turnover, benefits, performance, and training.
 |
604 individuals participated in the HR Daily Advisor’s HR Metrics Survey, conducted in April 2015.
Measures of Turnover
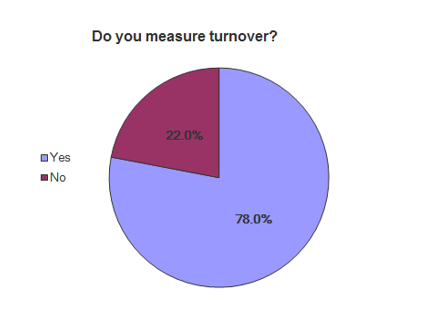
Turnover is clearly a very important metric for the HR professionals we surveyed—78% of participants measure it. When the issue was broken out into specific aspects, the factor most likely to be tracked by respondents was voluntary vs. involuntary turnover (80.9%), with position/level a distant second with 48%. Other turnover factors listed by participants included:
- High potentials
- Reasons for leaving
- Department
- Tenure

HR Metrics are being used in some very interesting ways by HR departments across the country. Learn what your competitors may be up to with our new research report, HR Metrics Best Practices: How Big Data Drives Big Decisions. Learn More.
Compensation-Related Metrics
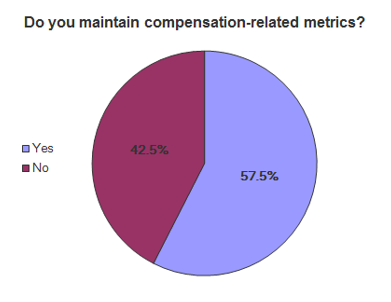
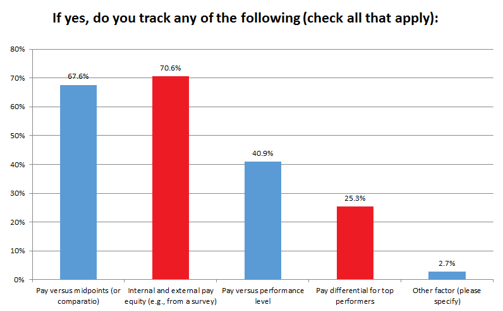
57.5% of respondents keep metrics relating to compensation, with large percentages of them tracking compensation by internal and external pay equity as well as pay vs. midpoints (or compa-ratio). Individual participants also specified that they have compensation metrics relating to seniority and retention bonuses.
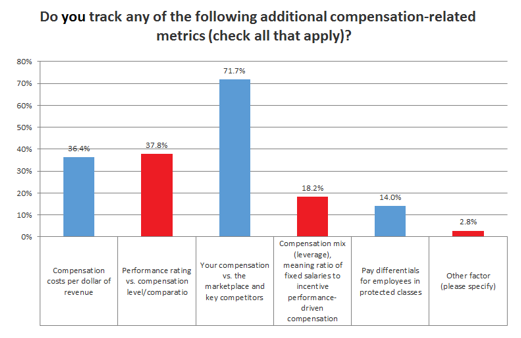
When we asked participants what other metrics they maintained regarding compensation, the highest percentage indicated that they compare their compensation against the marketplace and key competitors (71.7%). Respondents were less likely to track pay differentials for employees in protected classes, but this aspect is still tracked by 14%.
Benefits and Metrics
Nearly 67% of respondents maintain metrics related to their benefits programs. The most popular measurement was benefit costs per employee, and 1.7% of participants specified other factors they consider when analyzing benefits, including:
- Participation in company plans
- Regional and industry benchmarking
- Percentage of benefit cost borne by employee
HR Department Performance
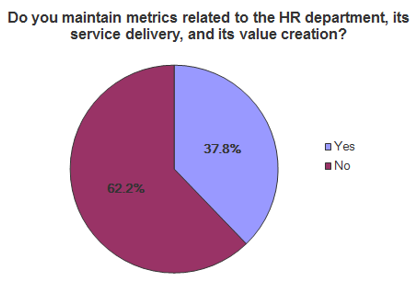
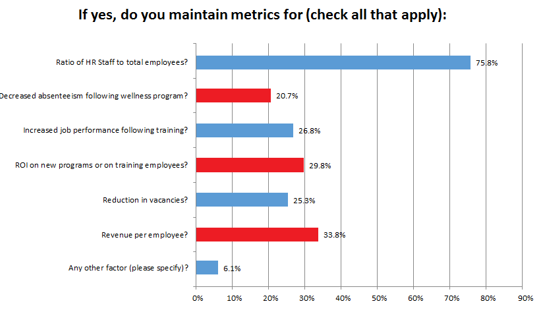
Next, we asked if participants maintained any metrics regarding the HR department itself. A minority of 37.8% do use analytics for the HR department, with the most common metric being the ratio of HR staff to total employees. Here are some other HR metric factors listed by participants:
- Customer satisfaction
- Wellness program participation
- Unemployment cost to the organization
- Surveys
Keeping Track of Training
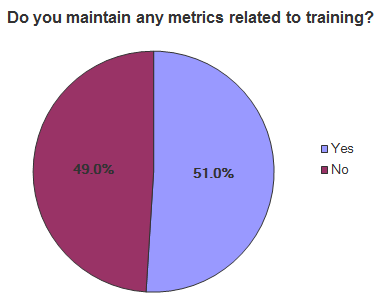
Participants were split almost right down the middle when it came to using metrics for analyzing training at their organization. Respondents were most likely to break out their training metrics by the type of training, followed by the quality of training as viewed by trainees, followed by the quality of training as viewed by managers.
What’s Your Most Useful Metric?
The final question of our HR Metrics Survey was open-ended: “Please share the metric or metrics that you find are the most useful to you.”
145 participants took the time to share their thoughts, and it shouldn’t be surprising, given our survey’s results, that turnover came up the most often—it was mentioned 61 times in responses to this question. Hiring, training, compensation, benefits, performance, and retention were also mentioned several times by participants. Costs in general were a recurring theme.
Here are some of the more detailed responses to this question:
- “For our small specialized company I find the benefits & compensation [metrics] are the most needed with our budget constraints.”
- “Most have value for seeing a good picture, however we are currently looking for suitable HR software to provide these metrics. We are having some difficulty selecting a comprehensive HRIS or HRM package to meet all of our needs.”
- “They are all useful. Most useful are the client metrics since we service numerous clients.”
- “Absenteeism by department.”
- “Data entry errors in HRIS—identifies rework and skill level and job knowledge and where to focus training needs.”
- “Seasonal employee return rate by department.”
- “Cost of various business Units/departments within the firm (i.e., this group comprises X% of the headcount but Y% of the overall cost).”
- “Funnel metrics (where do people fall out in the process), [and] sourcing metrics (how do we get our candidates).”
- “Completion of performance appraisals on a timely basis. Quality of performance appraisals. Total training hours per employee.”
- “I love metrics so hard to pick one. Turnover is what I discuss monthly.”
- “I most desperately need a good measure of both Employee Engagement and Onboarding efficacy.”
We also received some insightful feedback from participants after they took the survey. One respondent in particular made the point that “HR struggles to define its own added value,” which is demonstrated by the fact that HR measures processes over which it has no control. For example, time to fill is driven by hiring managers, and staff turnover could be a result of poor management or inadequate benefits/compensation levels set by executive staff. What does it mean for the future of HR metrics if they measure factors that HR itself has no ownership in and can take no credit or blame for?
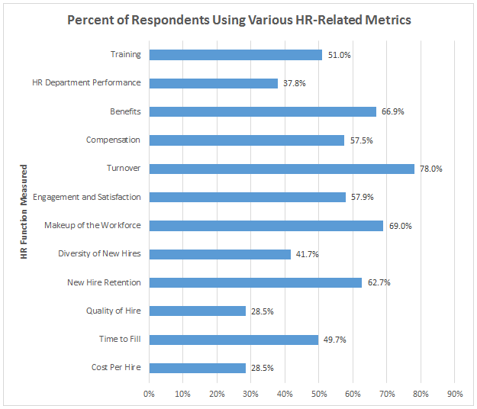
The following graph summarizes the extent to which our respondents are maintaining metrics for various HR functions. Turnover and makeup of the workforce are the most popular, while quality of hire and cost per hire were the functions least likely to be measured.
Clearly, HR metrics are evolving with the field as human resources takes on a more strategic role in organizations. It will be interesting to see which measurements will become more important in the near future—and which might fall by the wayside. Thank you to all who participated!
If you want to know more about what we learned, check out the premium version of the report. Six times a year, the HR Daily Advisor Research Team conducts detailed research into contemporary HR challenges to highlight best practices and common policies and procedures. For our latest report, we examined how metrics are being utilized in the field of human resources.
So you have collected a big heap of data. What do you do with it? What do you think your competitors do with it? We polled 604 people across numerous industries and disparate parts of the country to find out. See the results of our national survey as well as demographic breakdowns for each question.
Available in both print and downloadable PDF versions.
How do HR departments use the extreme amount of data available these days? It’s all in this report: HR Metrics Best Practices: How Big Data Drives Big Decisions. Click Here.
Among the features of this new product:
- Full results of our national survey addressing HR metrics
- Survey results broken down by key demographics such as HR department size and business type
- Executive summary and highlights
- And much more!
HR departments have access to an unparalleled amount of raw data these days. With the information in this report, you will get insight into the many ways HR departments around the country make use of them, perhaps even your competitors’ HR departments.
