Unit Performance Differentiation
It’s hard to read the numbers in the chart below, but it’s easy to see what the chart is saying.
The collection of data on the bottom right is for employees rated “needs improvement.” The middle grouping is for “successful” performers, and the grouping at the right is for “exceptional” performers. The chart shows the percentages of employees in each performance category over a 4-year period.
As you can see, Business Unit A (diamonds) does the best job at limiting the number of exceptional performers, generally below 20 percent of rated employees (and, thus, can reward them well). Business Unit C (triangles) does the worst job, with an almost equal number of “successful” and “exceptional” employees (and, thus, probably cannot differentiate meaningfully).

Comparative Compensation Scorecard
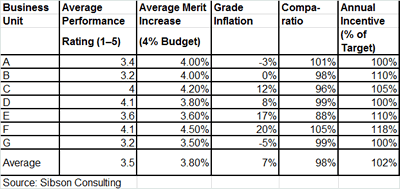
This chart, says Insler, compares compensation actions across units. In this case, for example, Business Unit D has the highest performance ratings, but low merit increases in spite of its low comparatio. This might bear looking into.

Connect Pay to Business Data
It is helpful to evaluate your average pay competitive position. This can be done in the aggregate, by business unit, or by employee level.
Be careful, however. Some companies may prefer to have fewer highly compensated employees while others desire a greater number of employees who are not as well compensated.
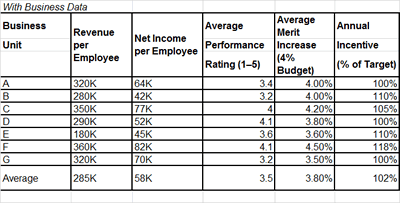
In the table below, business unit performance is compared to selected compensation data. Unit F, for example, has the highest net income per employee and the highest annual incentive. That’s what one might expect. However, Unit D, which has the lowest net income per employee, has the second highest annual incentive percentage; that might bear looking into.
Finally, a simple but comprehensive guide to wage and hour. Correctly apply the FLSA, remain the go-to expert with BLR’s comprehensive guide. Save hours of research time. Go here for information or to order Wage & Hour Compliance: Practical Solutions for HR
Comparative Compensation Scorecard

Tips for Developing a Compensation Scorecard
- Build a business case for why, what value, how to make better decisions, or keeping employees better informed.
- Start small and narrow, with just a few data points, to a few people, perhaps just senior execs.
- Make it “blind” at first, with no unit identification.
- Indicate how you compare: “our average merit was 3%, national average 2.5” or break down management v. hourly, etc.
- Expand as the organization gets comfortable with transparency.
Metrics and scorecards—compensation and benefits are never as easy as you wish they were. Even the most basic challenge—wage and hour—should be simple, but it’s just not. Complying with the Fair Labor Standards Act (FLSA) is one of the most confusing and challenging things comp pros have to do.
Even the most savvy practitioners get tripped up, and the law’s complex requirements can easily land you and your company on the wrong side of a lawsuit or in a Department of Labor (DOL) investigation.
Fortunately, there’s help—Wage & Hour Compliance: Practical Solutions for HR provides you with detailed guidance on how to comply with the FLSA, and it takes you through the most complicated wage and hour issues that HR practitioners encounter.
When you’re faced with a supervisor’s travel time question, an employee’s request for comp time, or another executive’s suggestion that more assistant managers be deemed exempt from overtime, you’ll find answers in seconds from a reputable and reliable source.
Wage and hour lawsuits are expensive—and easily prevented. Here’s how to protect against crippling judgments. Go here for information or to order Wage & Hour Compliance: Practical Solutions for HR
Wage & Hour Compliance: Practical Solutions for HR features:
- Real-world examples of wage and hour challenges and how to solve them;
- Multiple quizzes, so you can see where you need to review more carefully;
- An overtime exemption audit checklist, so you never make the wrong call;
- State-specific charts, for comparing your multistate obligations;
- Sample policies, easily modified to fit your specific preferences; and
- A quarterly newsletter, Wage & Hour Compliance Bulletin, to keep you aware of the latest developments in the law and why they matter to you.
Why are aggressive attorneys so eager to file claims on behalf of employees? Because there’s so much money to be made! Some examples are:
- $4.75 million: Hospital in Thousand Oaks, California, settles wage and hour lawsuit over miscalculated overtime pay and failing to compensate workers for missed meal and rest periods.
- $1.15 million: Las Vegas construction company to pay back wages to 1,060 current and former employees.
- $976,327: New Mexico aerospace company settles with 900 employees who were routinely required to work through lunch breaks without compensation.
- $340,400: New Jersey convenience store agrees to pay back wages and damages for violations of overtime and recordkeeping.
- >$84,541: New York physical therapist agrees to pay 22 employees for minimum wage violations.
- $30,000: Texas chain of four gas stations agrees to pay their six hourly employees, again, for recordkeeping and overtime violations.
Avoid steep fines. Go here for information or to order Wage & Hour Compliance: Practical Solutions for HR.
Buyers’ Benefit: To make sure your Wage & Hour Compliance: Practical Solutions for HR remains current with changing interpretations and court decisions, we monitor courts, Congress, and state legislatures. Each year, we’ll rush you an updated edition and bill on a 30-day review basis. You pay only if you decide to keep the updated edition.
Stay up to date with wage and hour changes. Go here for information or to order Wage & Hour Compliance: Practical Solutions for HR.
