In yesterday’s Advisor, we shared the results of our 2014 Performance Management survey; today, the rest of the results.
 |
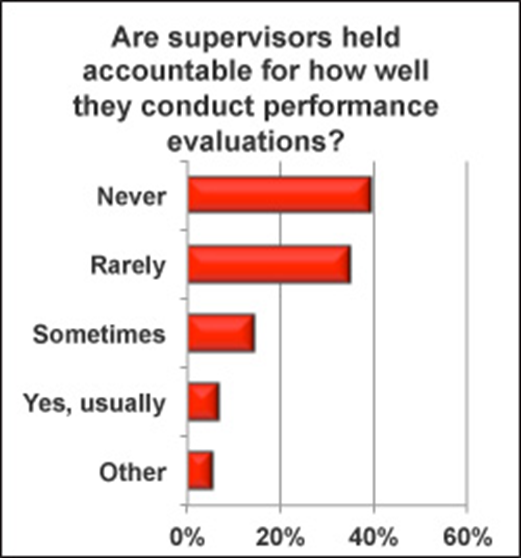
Supervisors’ Role in Performance Appraisals
Management’s top responsibilities when it comes to performance evaluations are writing evaluations of their direct reports for 85.6% of survey participants, followed closely by setting goals for/with employees for 78.3%, conducting review meetings for 75.3%, and coaching employees for improved performance for 75.3%. Finishing out the field is reviewing evaluations prepared by their direct reports for their own employees (64.6%), deciding employee salary raises (50.8%), and providing input to other supervisors on their direct reports (40.5%).
The errors performance evaluators make include: not completing the evaluation (13.8%), halo effect (18.6%), and horn effect (12.3%). The three most common errors are:
- Not following up with the employee to check on progress, 40.1%
- Not wanting to hurt feelings or overrate so evaluations place all employees in the middle of the scale, 40%
- Focusing on the most recent performance rather than the entire review period, 38.9%
|
Supervisor’s Error |
Percent reporting that error |
|
Rater does not follow up with employee after evaluation to check on progress |
40.1% |
|
Central tendency (Rater doesn’t want to hurt feelings or overrate so places all employees in the middle of the scale.) |
40.0% |
|
Recent effect (Rater focuses on most recent rather than entire review period.) |
38.9% |
|
Rater is late completing evaluations |
38.3% |
|
Leniency effect (Rater overrates to avoid making enemies.) |
37.6% |
|
Rater does not include details on why employee was rated a certain way |
37.4% |
|
Rater does not include a plan for improvement |
25.5% |
|
Halo effect (Rater evaluates overall performance based on a single area in which the employee excels.) |
18.6% |
|
Perceptual bias (Rater bases rating on their own perception of what is right or wrong or acceptable.) |
16.4% |
|
Rater does not complete the evaluations |
13.8% |
|
Primacy effect (Rater focuses on a good or bad incident from when the employee first came under his/her supervision.) |
13.8% |
|
Just like me tendency (Overrates employees who share his/her own interests/beliefs.) |
12.6% |
|
Horn effect (Rater underrates overall performance based on a single negative impression of the employee.) |
12.3% |
|
Other |
3.5% |
Struggling with compliance training? Start solving that problem on July 23, 2014 with a free interactive webcast 2014 Ethics and Compliance Training Benchmark Webinar: Priorities, Practices and Trends in Training. Learn More
Implementation of Performance Appraisals
When asked how they’ve successfully implemented performance appraisal programs, survey participants provided several helpful hints, including:
- Publish a performance calendar at the outset of the year:
- Personal follow up with delinquent supervisors/managers.
- Inform department directors of delinquent reviews.
- Send the CEO an overall status report on ratings, including who has not completed their reviews.
- Offer assistance as needed; train individually as requested.
- Tie to supervisor/manager job performance.
- View the process as developmental, not punitive.
- Make evaluation forms shorter.
- Tie all bonus disbursement for team to completion.
- Allow enough time to complete evaluations and supply support where needed.
- Automate the process.
HR’s responsibility for the performance appraisal process varies but several functions were widely practiced, including:
- Formal training for supervisors/evaluators, 50.8%
- Reviewing all evaluations, 54.5%
- Filing the paperwork, 56.9%
- Informal coaching for supervisors/evaluators, 60.3%
Additionally, for 40.7% of survey participants, HR screens performance evaluations for anything that might be illegal before supervisors/managers meet with employees.
Merit Increases
Evaluations are tied to most salary increases for 47% and are completely separate for 21.9%, and are partially tied together for 31.1%. Those who separate evaluations from increases do so because:
- A union agreement governs pay increases, 7.8%.
- Evaluations are conducted more frequently than raises are issued, 9.9%.
- Employee pay increases are on a different schedule than evaluations, 16.5%.
- They fear supervisors will be tempted to give good yet false appraisals so employees receive a good raise, 18.1%.
- Budget doesn’t allow for raises every time employees receive evaluations, 18.2%.
- Appraisals are more valuable and constructive if raises aren’t tied to them, 19.5%.
- It helps keep employees from having an entitlement mentality (evaluation = raise), 26.1%.
- They want to focus attention on employee performance instead of on amount of raise, 32.7%.
Compliance training benchmarks!. Join us for a free interactive webcast on 2014 Ethics and Compliance Training Benchmark Webinar: Priorities, Practices and Trends in Training . July 23. Earn 1 hour in HRCI Recertification Credit. Register Now
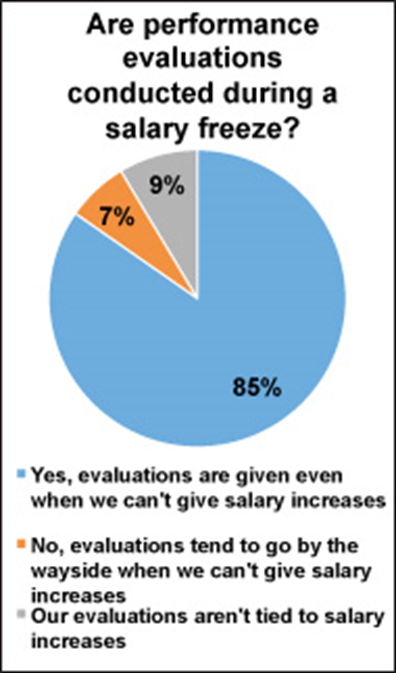
Appraisals Under Pay Freezes
Even if salary increases are not an option due to pay freezes or some other reason, 84.6% of survey participants still conduct performance appraisals.
Performance Pay by Employee Type
|
Type of Pay |
Execu-tive |
Middle manage-ment |
Profes-sional |
Exempt staff |
Non-exempt staff |
|
Bonus |
49.8% |
44.2% |
37% |
36.1% |
27.5% |
|
Merit plan |
46.4% |
55% |
54.2% |
56.1% |
55.1% |
|
Long-term incentive |
18.9% |
6% |
3.9% |
3.2% |
2.1% |
|
Commission |
4.9% |
3.7% |
4.3% |
4.1% |
4.6% |
|
Piece rate |
|
|
|
|
1.9% |
|
Other |
6.4% |
4.8% |
4.7% |
4.6% |
6% |
|
None |
26.9% |
28.4% |
30.7% |
30.1% |
31.4% |
Group Performance Pay by Employee Type
|
Type of Pay |
Executive |
Middle manage-ment |
Profes-sional |
Exempt staff |
Non-exempt staff |
|
Bonus |
25.2% |
22.5% |
19.2% |
19.4% |
15% |
|
Merit plan |
16.7% |
18.3% |
18% |
18% |
17.7% |
|
Long-term incentive |
7.8% |
3.1% |
2.4% |
1.6% |
1.3% |
|
Commission |
2.4% |
2.1% |
2.9% |
1.6% |
2% |
|
Piece rate |
|
|
|
|
1.6% |
|
Other |
2.2% |
2% |
2.1% |
2% |
2.5% |
|
None |
66.8% |
65.8% |
67.5% |
67.9% |
69.1% |
Survey Participants
Demographic breakouts of the 1,481 participants in the survey are below.
|
Number of Employees |
Percent of Respondents |
|
Up to 250 employees |
57.4% |
|
251 to 1,000 employees |
22.9% |
|
1,001 to 10,000 individuals |
16.9% |
|
More than 10,000 employees |
2.8% |
Of the participants responding to our survey, 39.4% have a workforce that is one-fifth or less exempt employees. Another 32.8% have a workforce that is more than one-fifth but less than one-half exempt and 27.8% have a workforce with more than one-half exempt employees. Unions represent employees at 22.2% of our survey participant employers.
Privately owned organizations are represented by 47.8% of survey participants and nonprofits account for 18.7%. Public corporations make up 8.6% and governments are represented by 10.1%.
Industries include manufacturing (15.4%); health care and social assistance (13.7%); finance and insurance (9.8%); and professional, technical, and scientific services (8.1%). Educational services represent 6.9% of our survey participants and retail trade accounts for 2.3%.
Our 1,481 survey participants’ positions:
|
Job Title |
Percent of Respondents |
|
HR Coordinator |
4.1% |
|
HR Generalist |
9.5% |
|
HR Specialist |
4.9% |
|
HR Manager |
26.5% |
|
HR Director |
24.3% |
|
HR VP or above |
9.2% |
|
Other area with HR responsibilities |
18.7% |
Thanks again to the 1,481 survey participants!
HRDA Announces Free Webcast on Compliance Training Practices
In early 2014, NAVEX Global partnered with an independent research agency to survey 700+ HR, ethics, compliance, and legal professionals about their compliance training practices. The purpose of the survey was to provide you access to benchmark data on the top priorities, practices and trends in ethics and compliance training.
The results of the survey—2014 Ethics and Compliance Training Benchmark Webinar: Priorities, Practices and Trends in Training—will be presented in a free webcast in just 60 minutes on July 23.
In this free webinar you’ll learn how top organizations are using creative approaches to cover more risk areas. You’ll also learn what your peers are saying is the single most effective training format for learning retention, behavior change, legal defensibility and more.
Register today for this free interactive webinar.
If you’ve been feeling like budget and seat-time are limiting your ability to train employees effectively or completely, you are not alone. Many organizations continue to struggle with covering all of their relevant risk areas and making sure supervisors get the training they need to handle complaints appropriately and avoid missteps.
Register today for this free interactive webinar.
Join us for our Training Benchmark webinar to learn from our compelling survey results and gain insights on questions such as:
- How much training are organizations doing?
- Are compliance professionals satisfied with their training programs?
- How are they measuring program effectiveness?
- How do they anticipate their training programs will evolve in the future?
Begin the journey to improving training effectiveness in your organization—register today!
Register now for this webcast.
Wednesday, July 23, 2014
2:00 p.m. (Eastern)
1:00 p.m. (Central)
12:00 p.m. (Mountain)
11:00 a.m. (Pacific)
Date or time doesn’t fit your schedule? Go ahead and register anyway. We will be sure you receive an email with a link to the recorded webinar following the event.
Register now for this webcast.
Approved for Recertification Credit
This program has been approved for 1 recertification credit hour toward recertification through the Human Resource Certification Institute (HRCI).
Join us on July 23 for the free, in-depth 2014 Ethics and Compliance Training Benchmark Webinar: Priorities, Practices and Trends in Training webcast.
3 thoughts on “Supervisors’ Most Common PA Mistakes (2014 Performance Management Survey)”