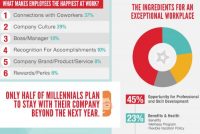
National unemployment rates are the lowest they’ve been since 2007, meaning it’s more and more difficult for employers to gain and retain top talent. Bottom line: keeping employees happy and engaged is more important than ever. Food for thought: Only half of Millennials plan to stay with their company beyond the next year. Every time […]
In 1996, fewer than one in 10 employees worked from home or outside the office. Recent figures from a study by TINYPulse show that more than one in three employees now utilize such flexible working arrangements. The concept of remote working is projected to grow even further in coming years, with one in three business […]
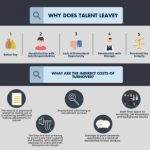
It’s time to face the reality that 83% of full-time employees in the US would consider leaving their current company. Take action at your workplace. This RecruitCon 2017 infographic outlines 5 reasons top talent leave, the indirect costs of turnover, and also the opportunities you can take advantage of to improve employee retention. For more ideas on how […]
UPDATE: The infographic below has been updated to reflect the current law in Cook County, IL—which takes effect July 1, 2017. Prior to 2014, there were only 4 paid sick leave laws in effect nationwide. That number has grown in the past 2 years to more than 30 laws, covering several states, cities, and counties. […]
Though federal law protects citizens’ right to vote, there is no federal law that mandates employers to give employees a specific amount of time off to do so. Many states have filled this void in the law with specific provisions and sanctions, which are covered below. Some states require employees to give reasonable notice of […]
Professional development has never been more important to organizational success. However, many companies are missing the mark when it comes to training opportunities, not realizing that a fine-tuned learning and development (L&D) program can have a measurable impact on your bottom line. We’ve identified the 5 signs of a stellar L&D program. View the infographic […]
Many employers are taking their workers’ parting words to heart, according to new research from staffing firm OfficeTeam. More than six in 10 (63%) human resources (HR) managers said their company commonly acts on feedback from exit interviews. “The only silver lining to losing employees is obtaining useful feedback to help stem further turnover,” said […]
The average salary increase in 2015 was 2.7%, according to a Society for Human Resource Management (SHRM) report. In its Human Capital Benchmarking Report, SHRM analyzed data from its benchmarking database, which contains organizational data from a random sample of the organization’s members. The salary increase information was collected in early 2016 from 1,143 employers. […]
It’s no secret, or coincidence, that if you’re a manager and you can keep your employees happy and motivated, they will respond by investing a greater degree of effort into their work, which in turn enhances the likelihood of company success. The infographic below from Ayers Management outlines just why it is so important to […]
When it comes to their jobs, new research reveals many professionals would like more information about how their efforts contribute to the company’s bottom line. While nearly half of workers in the Robert Half Management Resources survey reported they are always able to see the connection between their duties and their firm’s performance, the majority, […]


