In yesterday’s Advisor, we presented findings from the 2014 Holiday Practices Survey. Today, more from this timely study, including how companies are handling charitable donations, decorations, and gifts for employees.
 |
A total of 2,666 individuals participated in this survey conducted in October 2014.
Holiday Gifts
A cash bonus is planned for employees by 22.7%, gifts are planned by 14.1%, and 8.6% plan to offer both to their employees in 2015. The gifts include:
- Holiday meal, provided either at work or at a company-hosted party off-site, 31%
- “Take home” holiday meal, such as a ham or turkey, 10.5%
- Grocery store gift card, 15.4%
- Other gift card (e.g., gas card, prepaid debit, retail store), 21.4%
- Extra paid time off awarded, 1.3%
- Door prize or raffle giveaways, 7.1%
- Personal gifts, 13.2%

The size of planned bonuses are varied among respondents:
Holiday Cash Bonuses
| Bonus amount planned |
Response percent |
|
1% to 5% of base pay |
14.9% |
|
6% to 10% of base pay |
5.4% |
|
Lump sum of up to $250 |
23% |
|
Lump sum of $251 to $500 |
6.4% |
|
Lump sum of $501 to $1,000 |
5.3% |
Only gifts of nominal value may be accepted by employees from parties outside their organization (e.g., vendors, clients) for 41.9%. No employee gift policy is the norm for 24.3%, and no gifts may be accepted is the rule for 16.4%. All gifts must be reported to the company for 14.9% and only if over a certain amount for 28.7%.
Try BLR’s all-in-one compensation website, Compensation.BLR.com®, and get a complimentary special report, Top 100 FLSA Overtime Q&As, no matter what you decide. Find out more.
Deck the Halls
If their holiday decorations are within reason, 73.6% of survey participants (down from 82.6% last year) allow employees to display them. Another 18.8% (up from 12.1% last year) allow employees to display whatever they want. Display of nonreligious decorations only is allowed by 6%, and 1.6% (down from 3.2% last year) forbid employees from holiday decorating.
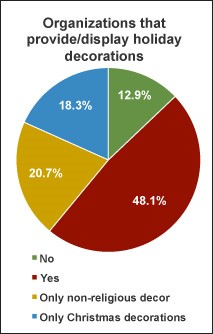
Along those same lines, 48.1% provide/display holiday-themed decorations in common areas at their facility, 18.3% do so only during Christmas, and 20.7% display only nonreligious seasonal decor. No company-sponsored decorations are displayed by 12.9%.

Of the 72.5% (up from 70% last year) of survey participants that host year-end or holiday parties for their employees, 61.3% (57% last year) go off-site, and 38.7% keep the festivities in-house. Alcoholic beverages are available for 53.9% (49% last year), and 36.6% (46% last year) allow spouses and/or significant others to attend the celebration.
Sharing
Though 10% have yet to decide about this year, charitable activities are sponsored by or participated in for 61.4% (65% last year). The types of activities are varied, with sponsoring a food drive topping the list at 54.8%. Volunteer work or visits by employees during working hours ends the list at 22.7%. Here’s the complete list:
- Food drive, 54.8%
- Toy drive, 52.3%
- Angel tree and/or adopt a family, 45.9%
- Monetary donation from company, 31.5%
- Monetary donation collected from employees, 29.8%
- Clothing drive, 28.8%
- Volunteer work or visits by employees during working hours, 22.7%
Survey Participants
A total of 2,666 individuals participated in this survey, which was conducted in October 2014. Of those who identified themselves, 61.4% represent private, for-profit organizations; 20.3% represent private, nonprofit; 9.2% are public sector; and 9% work for government.
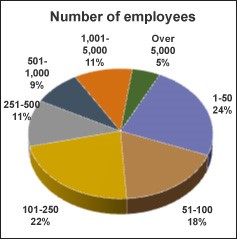
The majority (64.1%) of our survey respondents provide HR services to a workforce of 1–250 employees. Another 11.6% provide guidance to 251–500 employees at their organizations, and 8.7% have a workforce of 501–1,000 employees. Companies with more than 1,000 employees account for 15.7% of survey participants.

Fewer than 8% of employers surveyed have a 50%–100% unionized workforce. Also, 81.2% have a workforce with no union employees. A little over 26% of the respondents have a workforce of more than 50% exempt employees.
Over half (63.5%) of participants are in service industries; 23% are in agriculture, forestry, construction, manufacturing, or mining; 9.5% are in wholesale, retail, transportation, or warehousing; and 4.2% are in real estate or utilities.
Manager level is represented by 57.5% of survey participants, and VP or higher accounts for 21.9%. Supervisors are represented by 5%, and staff level account for 15.6% of survey participants who self-identified.
Thanks again to all who participated!
From setting the yearly holiday calendar to designing incentive plans, compensation and benefits are never easy. “Maintain internal equity and external competitiveness, with benefits and compensation, and control turnover, but still meet management’s demands for lowered costs.” Sound familiar?
Many of the professionals we serve find helpful answers to all their compensation and benefits questions at Compensation.BLR.com®, BLR’s comprehensive compensation website.
And there’s great news! The site has just been revamped in two important ways. First, compliance focus information has been updated to include the latest on the Consolidated Omnibus Budget Reconciliation Act (COBRA), Lilly Ledbetter, and the Family and Medical Leave Act (FMLA). Second, user features are enhanced to make the site even quicker to respond to your particular needs, such as:
- Topics Navigator—Lets you drill down by topical areas to get to the right data quickly
- Customizable Home Page—Can be configured to display whatever content you want to see most often
- Menu Navigation—Displays all the main content areas and tools that you need in a simple, easy format
- Quick Links—Enables you to quickly navigate to all the new and updated content areas
The services provided by this unique tool include:
- Localized Salary Finder. Based on reliable research among thousands of employers, there are pay scales (including 25th, 50th, 75th, and 90th percentiles) for hundreds of commonly held jobs, from line worker to president of the company. The data are customized for your state and metro area, your industry, and your company size, so you can base your salaries on what’s offered in your specific market, not nationally.
Try BLR’s all-in-one compensation website, Compensation.BLR.com®, and get a complimentary special report, Top 100 FLSA Overtime Q&As, no matter what you decide. Find out more.
- State and Federal Wage-Hour and Other Legal Advice. Plain-English explanations of wage-hour and other compensation- and benefits-related laws at both federal and state levels. “State” means the laws of your state because the site is customized to your use. (Other states can be added at a modest extra charge.)
- Job Descriptions. The website provides them by the hundreds, already written, legally reviewed, and compliant with the Americans with Disabilities Act (ADA) mandate that essential job functions be separated from those less critical. All descriptions carry employment grade levels to current norms—another huge time-saver.
- Merit Increase, Salary, and Benefits Surveys. The service includes the results of three surveys per year. Results for exempt and nonexempt employees are reported separately.
- Daily Updates. Comp and benefits news updated daily (as is the whole site).
- “Ask the Experts” Service. E-mail a question to our editors and get a personalized response within 3 business days.
If we sound as if we’re excited about the program, it’s because we are. For about $3 a working day, the help it offers to those with compensation responsibilities is enormous.
This one’s definitely worth a look, which you can get by clicking the link below.
Click here to get more information or start a no-cost trial and get a complimentary special report!
