To understand the importance of a total remuneration perspective, look at this table that reflects information about your CEO’s compensation, says Fichthorn, vice president in the Philadelphia office of Hay Group.
CEO Compensation Comparison—Total Direct Compensation
|
|
Marketplace Median |
President, XYZ Corp |
% of Median |
|
Base Salary |
$642,600 |
$949,000 |
148% |
|
Total Target Cash |
$1,099,100 |
$1,328,600 |
121% |
|
LTI Present Value |
$931,800 |
$259,250 |
28% |
|
Total Direct Comp |
$2,030,900 |
$1,587,850 |
78% |
If this analysis stopped here at a total direct comp level, you’d get the impression that the CEO of XYZ Corp is underpaid when compared to his or her peers. But that would be an inappropriate conclusion, Fichthorn says. Look at the table below, which adds information about the value of benefits to the chart:
CEO Compensation Comparison—Total Compensation and Benefits
|
Compensation Component |
Marketplace Median |
President, XYZ Corp |
% of Median |
|
Base Salary |
$642,600 |
$949,000 |
148% |
|
Total Target Cash |
$1,099,100 |
$1,328,600 |
121% |
|
LTI Present Value |
$931,800 |
$259,250 |
28% |
|
Total Direct Comp |
$2,030,900 |
$1,587,850 |
78% |
|
Benefit Total Value |
$207,829 |
$653,136 |
314% |
|
Total Remuneration |
$2,238,729 |
$2,240,986 |
100% |
Now we see the true picture, says Fichthorn, which is that the CEO of XYZ Corporation is paid right at the median of his or her peers.
What Are the Latest Trends in Executive Benefits?
The executive benefits landscape has changed over the past several years for a number of reasons, says Fichthorn:
- Struggling national and global economies
- Declining share prices
- Expanded proxy disclosures
- Intense public focus on executive benefits and compensation, both in the media and through Say on Pay
How can organizations best attract and retain executives in this environment? Organizations, both not for profit and for profit, must focus on the level and composition of executive benefit programs.
Organizations must also balance market-competitive considerations with shareholder and/or public interests.
Survey Pins Down Exec Pay Practices
A recent Hay Survey sought to obtain current data on the prevalence of practices regarding executive retirement and perquisites for employers of all sizes and across a broad group of industries, Fichthorn says.
There were 317 respondents from 8 industry classifications with revenues ranging from less than $50M to more than $20B.
Compensation.BLR.com, now thoroughly revamped with easier navigation and more complete compensation information, will tell you what’s being paid right in your state—or even metropolitan area—for hundreds of jobs. Try it at no cost and get a complimentary special report. Read more.
Executive Retirement Plans
In aggregate, nearly half of the participating organizations provide some type of nonqualified retirement plan, either defined benefit or defined contribution.

The market is evenly split between defined benefit and defined contribution programs; however, new programs are typically defined contribution, Fichthorn says.
Why Organizations Use Non-Qualified Retirement Plans
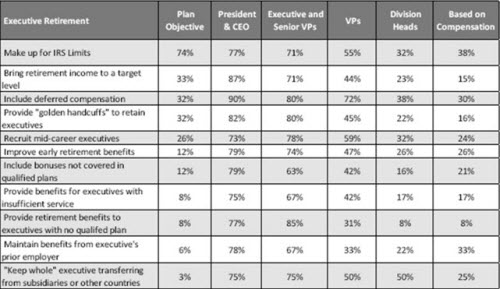
Organizations most often use nonqualified retirement programs to make up for IRS limits, says Fichthorn. The table below indicates percentages of respondents to the Hay Survey that indicated the various reasons for using non-qualified retirement plans, broken out by job level.
Other findings related to nonqualified retirement plans include the following:
Funding Retirement Pland
- 52% of respondents informally fund their nonqualified retirement programs
- Rabbi trust is the most prevalent in the general market
Vesting Retirement Plans
- 16% have immediate vesting
- 40% have service-based cliff vesting
- 20% have age-based cliff vesting
- 17% have graded vesting
Try BLR’s all-in-one compensation website, Compensation.BLR.com, and get a complimentary special report, Top 100 FLSA Overtime Q&As, no matter what you decide. Find out more.
Most Common Perquisites for Executives
Perquisites continue to be part of executive compensation packages; however, the level and mix demonstrates the impact of regulation and public scrutiny, Fichthorn says.
|
Executive Perquisite |
Offered |
President & CEO |
Execu- |
VPs |
Division Heads |
Based on Compensation |
|
Cellular Phones |
79% |
94% |
87% |
83% |
67% |
9% |
|
Exec Severance Pay Practice |
51% |
87% |
80% |
58% |
29% |
8% |
|
Employ- |
48% |
19% |
55% |
23% |
13% |
8% |
|
Exec Physical Exams |
43% |
96% |
85% |
55% |
20% |
4% |
|
Golden Para-chutes |
42% |
92% |
83% |
31% |
13% |
7% |
|
Exec Parking |
39% |
95% |
83% |
56% |
27% |
1% |
|
Exec Group Life Insurance |
37% |
88% |
80% |
57% |
22% |
10% |
|
Exec LTD |
37% |
84% |
80% |
60% |
26% |
22% |
|
Car Allowance |
36% |
78% |
71% |
56% |
34% |
4% |
|
Average Car Allowance Amount |
|
$11,988 |
$10,921 |
$10,376 |
$11,187 |
$7,667 |
|
Personal Financial Coun-seling/Tax Prep |
31% |
95% |
82% |
40% |
19% |
6% |
|
Company Cars |
30% |
93% |
57% |
38% |
24% |
4% |
Only 18% of organizations gross up any perquisites provided, with car allowance the most commonly grossed up benefit, Fichthorn says.
In tomorrow’s Advisor, the public’s breaking point on exec comp, plus an introduction to the all-comp-in-one site, Compensation.BLR.com.
Any suggested sources for executive comp benchmark data?