Special thanks to all readers who participated in our surveys in 2013! (2014 surveys start soon.)
Benefits: Health Insurance
Preferred provider organization (PPO) plans are offered by 68% of survey participants, and health maintenance organization (HMO) plans are offered by 31%. High-deductible plans are a benefit for 35%, and point-of-service (POS) plans are available for 13%. “Other” captured 6% and, coming in last were traditional indemnity plans with 5%.
Offering high-deductible plans has been considered by 44% of survey participants, leaving 40% that haven’t considered it, 13% that don’t know if they have or not, and 2% in the “other” basket.
FSAs (flexible spending accounts) are not an option for 39% of survey participants. FSAs are available to 51% for child care, 12% for elder care, 58% for health care, and 2% for disability insurance.
For survey participants that had increased health insurance costs in 2013, 58% passed some of the increase along to employees, 6% passed along most of the increase, and another 6% passed on all of the increased cost to employees.
Compensation.BLR.com, now thoroughly reved with easier navigation and more complete compensation information, will tell you what’s being paid right in your state—or even metropolitan area—for hundreds of jobs. Try it at no cost and get a complimentary special report. Read more.
Benefits: Retirement
Offering either a 401(k) or 403(b) retirement savings plan to employees is a widely accepted practice for U.S. employers. In fact, 86% of the employers responding to our survey offer one of these plans. Only 33% of those who answered the question, however, automatically enroll employees, though 2.5% plan to implement autoenrollment in the future.
The number of employees that voluntarily participate in their 401(k) or 403(b) plans is less than 30% for 26% of survey participants, 31% to 70% for 35% of them, and above 70% for 39%.
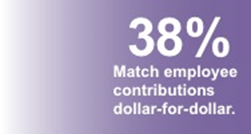
The percentage of their earnings that employees begin with when contributing to voluntary 401(k) or 403(b) plans is less than 3% of base salary for 25% of our survey participants. It’s 3% of earnings for 30% and 4% of salary for 16%, 5% of their base salary for 14% of employers, at 6% of salary for 12%, and over 6% of earnings for 3% of employers.
The addition of a defined benefit plan is planned for 5%, and 9% expect to increase the employer contribution to their existing plan. For 10%, however, a reduction in their employer contribution is planned, and for 4%, their defined benefit plan will be eliminated altogether.
Other retirement benefits offered by our survey participants include defined benefit plans (23%), Roth 401(k) (30%), 457 plan (11%), profit-sharing (21%), stock options (4%), employee stock ownership plan (6%), union-sponsored pension plan (3%), and/or SIMPLE or SEP (27%).
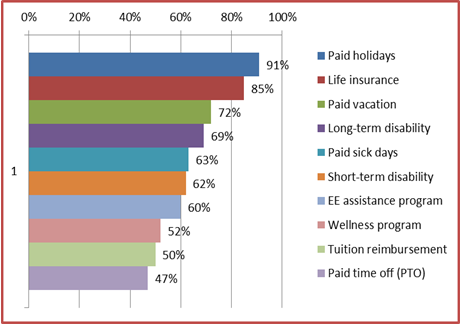
Benefits: Perks
From health insurance to stock options to paid vacation, employees love perks, but not all employers provide them.
What ‘Atypical’ Benefits Are Offered?
How Do Employers Determine Benefits to Offer?
Conducting employee surveys to find out which benefits they like is how 26% of employers determine what nonwage benefits to offer employees, and 43% evaluate the benefits offered by other companies as well as their competitors. Hiring a consultant to develop a benefit plan, however, is the norm for 23%.
Training & Development
HR wears multiple hats when it comes to implementing training programs. For example, HR evaluates training materials/options for 59% of our survey participants and purchases the materials for 47%. HR schedules training sessions (64%) and conducts the training (57%).
When asked who makes decisions about training, 70% of the participants in our survey indicate that it’s executive management. Human resources management is involved in making those decisions for 67%. In-house counsel is involved in the decision-making process for 8%, and training/development staff is involved for 39% of survey participants.
A half hour is the preferred session length for legal compliance training of employees for 24% of survey participants, and it’s 1 hour for 28%. At 10%, 2 hours is the third most selected, and 8% believe 45 minutes is the best length of time for training. All-day training is preferred by 4%, and another 4% prefer half-day sessions.
Provided by 73%, job-related skills leads the list of professional development training for employees. Communication and customer service skills, at 66% and 59% respectively, come in second and third in our survey. Teambuilding (49%), computer skills (46%), and time management (36%) round out the field.
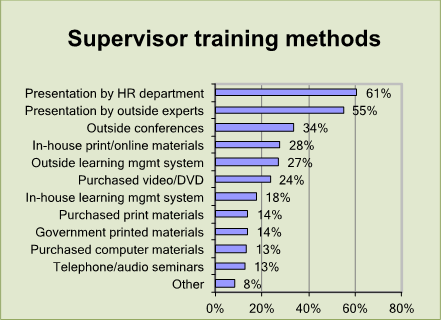
Leadership/management is the professional development topic covered most (75%) when training supervisors, with communication and dealing with problem employees, both at 72%, following closely. Coming in next is teambuilding at 58%, and mentoring/coaching is right on its heels at 57%. Employee retention and motivation is a must-have for 51%.
The leading professional development topic for training HR staff is job analysis/job descriptions at 54%. Compensation/benefits programs/practices (52%) and employee/labor relations (51%) follow closely. Benefits selection/management comes in at 47%. Leadership and communication/presentation tie at 45%.
How Do Employers Feel About Their Performance Management?
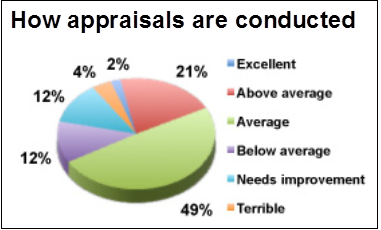
A hefty 72% rate the way their organizations conduct performance appraisals as average or above, with excellent as the rating for 2%, above average selected by 21%, and the remaining 49% rating their organization as average. On the flip side, however, 28% rate their organization as below average, needs improvement, or terrible in the way that they conduct their performance evaluations.
Overall performance is measured by 80% of survey participants, and specific attributes are also measured by 48%. Completion of specific goals is a measurement criterion for 51%.
A common review date is utilized by 56% of participants, and a variation of common review dates (e.g., common dates staggered by groups) is used by 7%. Appraisals are spread out over the year for 25%, and a combination of common date and scattered throughout the year is used by 9% of survey participants. Conducting all reviews at the same time is preferred by 47%, and 28% prefer that they be spread throughout the year. A combination is preferred by 17%, and 8% had no opinion one way or the other.
The frequency with which individual pay-for-performance plans are aligned with organizational objectives and strategies is annually for 59% and biannually for 1%. Alignment is intermittent with no set schedule for 11% and never (as far as they know) for 24% of survey participants.
Appraisal forms with ratings/scales work well for 78%, and essay questions work for 24%. Multiple-choice review statements/questions work well for 13%, and 7% like yes/no statements/questions.
Performance review software is not an option for 62% of survey participants, and 11% have no performance appraisal software but are interested in learning more about it. Software is used by 12% with good results, but using it hasn’t improved the process for another 8%. A small number, (1%), have looked for such software but have not found anything that meets their needs.
Not every employer conducts performance appraisals, and when asked what they do instead, survey participants indicated the following alternatives:
- Nothing.
- Annual across-the-board adjustments.
- Manage, monitor, and give performance feedback as required.
- Performance log, which provides continuous performance documentation.
Pay Budgets
Of those who had decided at the time of this survey (June 2013), on average across all employee types, 17.8% of the employers expect to offer 2014 merit increases of up to 2.5%, 49% plan no increase, 29.6% plan to offer merit increases of 2.5% to 5%, and 3.5% plan to offer increases above 5%.
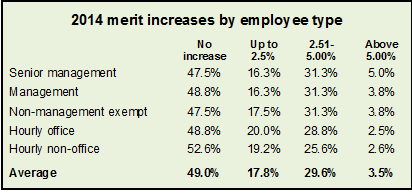
The breakdown of employee types shows 16.3% of employers plan merit increases of up to 2.5% to senior management, 16.3% plan that amount for management, 17.5% plan it for nonmanagement salaried exempt employees, 20% plan the same for hourly office employees, and 19.2% plan to award up to 2.5% of base pay as an increase to hourly nonoffice employees. Among employers planning merit increases for 2014, the most common amount is 2.5% to 3% for exempt nonmanagement employees and 3.01% to 3.50% for senior management, management, and hourly nonoffice employees.

A little over 10% of those responding to our survey provided information regarding their plans for bonuses in 2014. Of those that did, on average, 7.4% plan to offer bonuses of up to 2.5% of base pay, and 5.5% plan to offer 2.5% to 5%. Another 3.3% plan bonus amounts in 2014 of 5.01% to 10%, and bonus amounts of over 10% are planned for an average of 10.9% of the survey participants that answered this question. Though 7.9% plan to award bonuses in lieu of pay increases, 34% will award bonuses in addition to salary increases, and 17.5% plan to award both bonuses and increases in 2014.
Wage-related issues survey participants expect to have at the end of 2014 include trying to keep up with competitors’ wage rates for 27% and dealing with budget constraints for 24%. Another 12% expect that retaining employees who still receive low pay may be a concern. The impact of the Affordable Care Act and rising benefits costs will be an issue for 13%, and maintaining company profitability is an important issue for 7%. An uncertain economy continues to be an issue for 4%, and achieving internal equity is a concern for 5%.
How About Policy Development?
Our 2013 Policies Survey reveals that 93% of participants have formalized policies. The most widely implemented policy, once again, is antiharassment and/or antidiscrimination with 94.6% of survey participants having such a policy compared to 94.5% in 2012. Following closely behind is discipline/termination at 90.6%, computer and Internet use at 90.3%, and employee leave at 90%. Coming in last is Bring Your Own Device (BYOD) at 11.6%. When asked how often policies are updated, 45.4% of survey respondents indicate they update policies as needed, and 27.3% state they update policies annually.
Which Policies Will Be Updated?
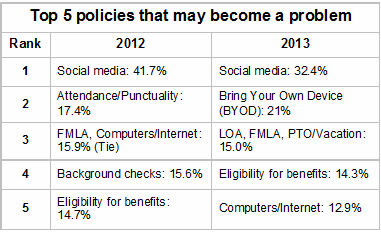
Though social media policies were uppermost in the minds of 50% of our 2012 survey participants when asked which policies were next in line to be updated, employee leave and social media almost tied, 34.6% and 34.5% respectively, as the next policy to tackle in 2013. Following closely behind are benefit eligibility policies (27.1%) and attendance/punctuality (25%). Discipline/termination and computers/Internet are next with 23.6% and 22.6%, respectively. Background check policies are a priority for 22.3% of respondents. Revamping their antiharassment/antidiscrimination policy will be a project for 22.1% of respondents while updating their cell phone/distracted driving policy is on the agenda for 21.1%.
Employee handbooks are the policy distribution method of choice for 55.4% of survey participants. Their internal website (intranet) is utilized by 35.4%, and e-mail is the distribution vehicle for 10.5%, while 3.7% distribute their policies via loose-leaf memo, and 1% do not distribute handbooks or written policies to employees. Our old friend “other” contained some interesting responses, including:
- Employees are told where the policy book is, and they are encouraged to read through it.
- Annual meeting/PowerPoint® presentations.
- Learning Management System mandatory courses.
- Sent to employees when asked.
- Posted on bulletin board.
- Employee agreement has some rules and policies.
- What are you talking about, employee handbook?
- Shared Google doc.
- Employee communication board.
- We use all of the above randomly; handbooks are outdated.
- Policy handbook that is changed verbally.
Management team members’ tendency to enforce only “some” policies is cited by 67.9% of survey participants as the biggest stumbling block to overall policy enforcement. The need to update policies is a stumbling block for 30.5%, and having policies that are difficult to understand is an issue for 11.8%.
Retaining policies that should be canceled is a stumbling block for 11.6%, and inadequate or lack of distribution is a problem for 9.7%.
Your HR Department
When asked about their staff-to-employee ratio, 42.4% indicated that their HR departments operate with a ratio of 1 HR professional to 101–200 or more employees. A closer look shows that 18.2% operate with a ratio of 1 to 101–150, 10.1% operate with a ratio of 1 to 151–200, and 14.1% operate with a ratio of 1 HR professional to 201 or more employees. On the flip side, 26.3% operate with a ratio of 1–50, and 31.3% operate with 1 HR professional for 51–100 employees.
Of those that do, the most frequently outsourced function is background/reference checks at 67.1% (up from 60% last year), followed by payroll for 29.2% (down from 38% last year), then unemployment and workers’ compensation claims processing at 24.8% and 24.7%, respectively (28% and 27% last year). Benefits administration is outsourced by 20.5% of respondents (down from 23% in 2012). Additional outsourced functions include training at 6.9% and recruiting/staffing at 6.1%.
HR is viewed as a strategic partner by management teams for 32.5% of survey participants and as a credible business asset for 29.4%. It’s still viewed as an administrative function, though, for 34.1%.
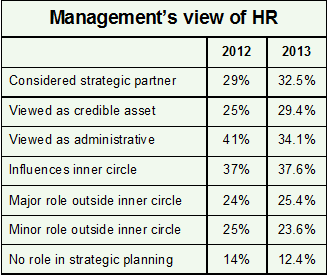
Over 75% of our survey participants play a role in strategic business planning, with 37.6% holding a position of influence within the inner circle. HR plays a major role, though outside the inner circle, for 25.4%, and at least 23.6% of HR departments play a minor role. HR has no role in strategic business planning for 12.4% of survey respondents.
Employee Leave
As expected, paid vacation time, separately or as PTO, is available to over 96% of those responding to our survey, while paid sick leave is an option for 83.2%, and paid personal days are available for 41.5%, up from 39% in 2012. Bereavement leave is offered by 84.4%, compared to 82% in 2012, and 99.6% offer 6 or more paid holidays per year. Extended medical leave is offered by 59%, a big jump from 27% in 2012, and maternity/paternity leave is offered separate from other sick leave by 26.6%, a small bump up from 24% last year.
Paid short-term disability (STD) leave of less than 30 days is an option for 11.7% of survey participants who responded to this question. STD leave of 31–90 days is available to 42.6%, and 91–180 days is allowed for 40%. When it comes to how much of STD leave is paid, 59.6% cover 51% to 75% of employees’ base pay, and 20.4% cover 76% to 100%.
Paid long-term disability (LTD) leave of more than a year is available for 51.3% of survey participants who answered this question. LTD of 6 months to a year is an option for 17.8%, and 4–6 months of paid LTD is available for 11.9%, while 2–4 months is a benefit for 11.2%. LTD pay covers 51% to 70% of base pay for 75.1% and 26% to 50% of base pay for 11.9%
When asked to indicate their top challenges regarding employee leave, scheduling workloads around employee leave topped the list at 47%. Recordkeeping and/or tracking leave at 38.9% and abuse of leave at 37.7% came in second and third, respectively. Family and Medical Leave Act (FMLA) intermittent leave came in fourth at 33.2%, and consistent application of leave policies was fifth at 27.1%.
Holidays
When asked how many paid holidays their employees will receive in 2014,
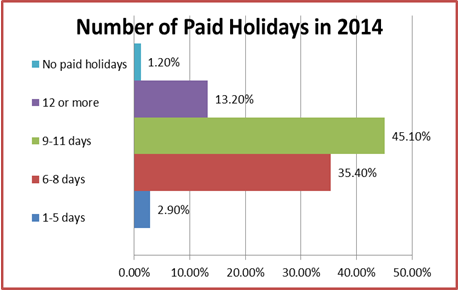
Memorial Day, Independence Day, Labor Day, Thanksgiving Day, Christmas Day, and New Year’s Day will be offered as paid holidays by at least 94% of survey participants in 2014. Martin Luther King Jr. Day and Presidents’ Day will be paid holidays for 32% and 32.2%, respectively.
When it comes to deciding which employees get priority in selecting their days off during the holidays, 25.1% leave it up to the supervisor, and 23.8% go with whoever asks first. It’s not a problem and everyone gets what he or she wants for 13.9%, but for 9.4%, employees take turns from year to year. A formal system based on seniority is in place for 8.5%, and 10.6% use an informal seniority/ranking system.
If their holiday decorations are within reason, 82.6% of survey participants allow employees to display them. Another 12.1% allow employees to display whatever they want. Only 3.2% forbid employees from holiday decorating.
Along those same lines, 47.9% provide/display holiday-themed decorations in common areas at their facility, and 34.1% do so only during Christmas. No company-sponsored decorations are displayed by 15.5%.
Recruiting and Retention
When asked which methods are used to recruit for open positions, online recruiting leads the pack at 79.7%, followed closely by employee referral at 74.9%. Coming in at a distant third is newspaper ads at 44.4%. Employment agencies/headhunters and staffing firms/temp agencies are neck and neck at 39.7% and 38.6%, respectively, with job fairs right on their heels at 38.5%.

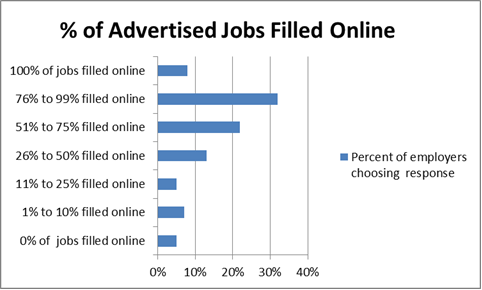
All open positions are posted online for 41% of survey participants who answered the question, and over three-fourths of open positions are posted online for 29.9%. When asked how many advertised jobs are filled from online applicants, 31.7% indicated that over 75% of their jobs are filled that way, and for 21.9%, from 51% to 75% of jobs are filled by online applicants.
The positions most successfully recruited online are entry-level at 29.5%, followed closely by professionals at 29%. Mid-level comes in third at 24.2%. Just posting open positions online is the routine for 33.7% of survey participants, and searching through posted résumés is an option for 13.1%. Both posting and searching, though, are the path to success for 34%.
One participant, however, commented and provided a list of 10 ways (see below) to not only ensure retention but also develop engaged, loyal employees.
You retain your best employees by encouraging a corporate culture that makes your organization both a great and productive place to work, primarily by:
- Making hiring decisions based on diversity and soft skills as well as experience/expertise.
- Clearly communicating your expectations and always expecting excellence.
- Adequately preparing new employees.
- Trusting your employees. Allowing them to make some mistakes.
- Recognizing each person has different supervision needs.
- Catching employees doing things right.
- Leading by example.
- Encouraging individualism within the boundaries of respect and consideration.
- Looking for daily opportunities for transparency.
- Terminating quickly if an employee proves unsalvageable.
The survey participant also commented that if top management does these things, you will not only retain your employees, but they will also be fully engaged and fanatically loyal.
Thanks to all readers who responded to our surveys in 2013! First 2014 survey coming soon.